
Page 102 - Annual Report 2020
P. 102
1.11 Performance by commodity
Management believes the following financial information presented For a reconciliation of Alternative Performance Measures to
by commodity provides a meaningful indication of the underlying their respective IFRS measure and an explanation as to the
financial performance of the assets, including equity accounted use of Underlying EBITDA and Underlying EBIT in assessing
investments, of each reportable segment. Information relating to our performance, refer to section 6.1. For the definition and
assets that are accounted for as equity accounted investments is method of calculation of Alternative Performance Measures,
shown to reflect BHP’s share, unless otherwise noted, to provide refer to section 6.1.1.
insight into the drivers of these assets. For more information as to the statutory
For the purposes of this financial information, segments are determination of our reportable segments,
reported on a statutory basis in accordance with IFRS 8 ‘Operating refer to note 1 ‘Segment reporting’ in section 5.
Segments’. The tables for each commodity include an ‘adjustment Unit costs is one of the financial measures used to monitor the
(1)
for equity accounted investments’ to reconcile the equity performance of our individual assets and is included in the analysis
accounted results to the statutory segment results. of each reportable segment.
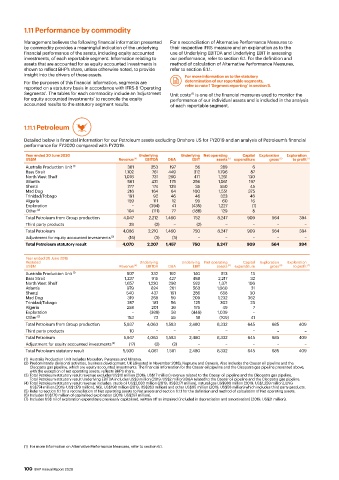
1.11.1 Petroleum
Detailed below is financial information for our Petroleum assets excluding Onshore US for FY2019 and an analysis of Petroleum’s financial
performance for FY2020 compared with FY2019.
Year ended 30 June 2020 Underlying Underlying Net operating Capital Exploration Exploration
US$M Revenue (4) EBITDA D&A EBIT assets (5) expenditure gross (6) to profit (7)
Australia Production Unit (1) 361 253 197 56 289 6
Bass Strait 1,102 761 449 312 1,796 87
North West Shelf 1,076 731 260 471 1,261 130
Atlantis 561 431 175 256 1,061 197
Shenzi 277 174 139 35 550 45
Mad Dog 216 164 64 100 1,551 375
Trinidad/Tobago 191 92 46 46 323 46
Algeria 159 111 12 99 60 16
Exploration − (394) 41 (435) 1,227 (1)
Other (2) 104 (111) 77 (188) 129 8
Total Petroleum from Group production 4,047 2,212 1,460 752 8,247 909 564 394
Third party products 39 (2) − (2) − − – –
Total Petroleum 4,086 2,210 1,460 750 8,247 909 564 394
Adjustment for equity accounted investments (3) (16) (3) (3) − − − − −
Total Petroleum statutory result 4,070 2,207 1,457 750 8,247 909 564 394
Year ended 30 June 2019
Restated Underlying Underlying Net operating Capital Exploration Exploration
(5)
US$M Revenue (4) EBITDA D&A EBIT assets expenditure gross (6) to profit (7)
Australia Production Unit (1) 507 332 192 140 513 13
Bass Strait 1,237 915 427 488 2,217 32
North West Shelf 1,657 1,220 298 922 1,371 106
Atlantis 979 824 261 563 1,060 31
Shenzi 540 437 151 286 658 30
Mad Dog 319 268 59 209 1,232 362
Trinidad/Tobago 287 181 56 125 302 23
Algeria 258 201 26 175 49 7
Exploration − (388) 58 (446) 1,039 −
Other (2) 153 73 55 18 (109) 41
Total Petroleum from Group production 5,937 4,063 1,583 2,480 8,332 645 685 409
Third party products 10 − − − − − – –
Total Petroleum 5,947 4,063 1,583 2,480 8,332 645 685 409
Adjustment for equity accounted investments (3) (17) (2) (2) − − − − −
Total Petroleum statutory result 5,930 4,061 1,581 2,480 8,332 645 685 409
(1) Australia Production Unit includes Macedon, Pyrenees and Minerva.
(2) Predominantly divisional activities, business development, UK (divested in November 2018), Neptune and Genesis. Also includes the Caesar oil pipeline and the
Cleopatra gas pipeline, which are equity accounted investments. The financial information for the Caesar oil pipeline and the Cleopatra gas pipeline presented above,
with the exception of net operating assets, reflects BHP’s share.
(3) Total Petroleum statutory result revenue excludes US$16 million (2019: US$17 million) revenue related to the Caesar oil pipeline and the Cleopatra gas pipeline.
Total Petroleum statutory result Underlying EBITDA includes US$3 million (2019: US$2 million) D&A related to the Caesar oil pipeline and the Cleopatra gas pipeline.
(4) Total Petroleum statutory result revenue includes: crude oil US$2,033 million (2019: US$3,171 million), natural gas US$980 million (2019: US$1,259 million), LNG
US$774 million (2019: US$1,179 million), NGL US$198 million (2019: US$263 million) and other US$85 million (2019: US$58 million) which includes third party products.
(5) Refer to section 6.1 for a reconciliation of Net operating assets to Net assets and section 6.1.1 for the definition and method of calculation of Net operating assets.
(6) Includes US$170 million of capitalised exploration (2019: US$297 million).
(7) Includes US$ nil of exploration expenditure previously capitalised, written off as impaired (included in depreciation and amortisation) (2019: US$21 million).
(1) For more information on Alternative Performance Measures, refer to section 6.1.
100 BHP Annual Report 2020