
Page 98 - Annual Report 2020
P. 98
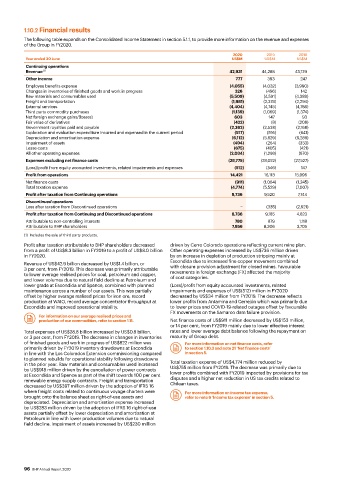
1.10.2 Financial results

          The following table expands on the Consolidated Income Statement in section 5.1.1, to provide more information on the revenue and expenses
          of the Group in FY2020.
                                                                                   2020        2019       2018
          Year ended 30 June                                                      US$M        US$M       US$M
          Continuing operations
          Revenue  (1)                                                            42,931     44,288      43,129
          Other income                                                              777        393         247
          Employee benefits expense                                               (4,055)    (4,032)     (3,990)
          Changes in inventories of finished goods and work in progress             326       (496)        142
          Raw materials and consumables used                                      (5,509)     (4,591)    (4,389)
          Freight and transportation                                              (1,981)     (2,378)    (2,294)
          External services                                                       (4,404)     (4,745)    (4,786)
          Third party commodity purchases                                         (1,139)     (1,069)    (1,374)
          Net foreign exchange gains/(losses)                                      603         147         93
          Fair value of derivatives                                                (422)        (8)       (208)
          Government royalties paid and payable                                   (2,362)    (2,538)     (2,168)
          Exploration and evaluation expenditure incurred and expensed in the current period  (517)  (516)  (641)
          Depreciation and amortisation expense                                    (6,112)   (5,829)     (6,288)
          Impairment of assets                                                     (494)       (264)      (333)
          Lease costs                                                              (675)      (405)       (421)
          All other operating expenses                                            (2,034)     (1,298)     (870)
          Expenses excluding net finance costs                                   (28,775)    (28,022)   (27,527)
          (Loss)/profit from equity accounted investments, related impairments and expenses  (512)  (546)  147
          Profit from operations                                                  14,421      16,113     15,996
          Net finance costs                                                         (911)     (1,064)    (1,245)
          Total taxation expense                                                  (4,774)    (5,529)     (7,007)
          Profit after taxation from Continuing operations                        8,736       9,520       7,744
          Discontinued operations
          Loss after taxation from Discontinued operations                            −        (335)     (2,921)
          Profit after taxation from Continuing and Discontinued operations       8,736       9,185      4,823
          Attributable to non-controlling interests                                 780        879        1,118
          Attributable to BHP shareholders                                        7,956       8,306      3,705
          (1)  Includes the sale of third party products.
          Profit after taxation attributable to BHP shareholders decreased   driven by Cerro Colorado operations reflecting current mine plan.
          from a profit of US$8.3 billion in FY2019 to a profit of US$8.0 billion   Other operating expenses increased by US$736 million driven
          in FY2020.                                         by an increase in depletion of production stripping mainly at
          Revenue of US$42.9 billion decreased by US$1.4 billion, or   Escondida due to increased fine copper movement combined
                                                             with closure provision adjustment for closed mines. Favourable
          3 per cent, from FY2019. This decrease was primarily attributable
          to lower average realised prices for coal, petroleum and copper,   movements in foreign exchange (FX) affected the majority
                                                             of cost categories.
          and lower volumes due to natural field decline at Petroleum and
          lower grade at Escondida and Spence, combined with planned   (Loss)/profit from equity accounted investments, related
          maintenance across a number of our assets. This was partially   impairments and expenses of US$(512) million in FY2020
          offset by higher average realised prices for iron ore, record   decreased by US$34 million from FY2019. The decrease reflects
          production at WAIO, record average concentrator throughput at   lower profits from Antamina and Cerrejón which was primarily due
          Escondida and improved operational stability.      to lower prices and COVID-19-related outages offset by favourable
                                                             FX movements on the Samarco dam failure provision.
               For information on our average realised prices and
               production of our commodities, refer to section 1.11.   Net finance costs of US$911 million decreased by US$153 million,
                                                             or 14 per cent, from FY2019 mainly due to lower effective interest
          Total expenses of US$28.8 billion increased by US$0.8 billion,    rates and lower average debt balance following the repayment on
          or 3 per cent, from FY2019. The decrease in changes in inventories   maturity of Group debt.
          of finished goods and work in progress of US$822 million was   For more information on net finance costs, refer
          primarily driven by FY2019 inventory drawdowns at Escondida    to section 1.10.3 and note 21 ‘Net finance costs’
          in line with the Los Colorados Extension commissioning compared   in section 5.
          to planned rebuilds for operational stability following drawdowns
          in the prior year. Raw materials and consumables used increased   Total taxation expense of US$4,774 million reduced by
          by US$918 million driven by the cancellation of power contracts    US$755 million from FY2019. The decrease was primarily due to
          at Escondida and Spence as part of the shift towards 100 per cent   lower profits combined with FY2019 impacted by provisions for tax
          renewable energy supply contracts. Freight and transportation   disputes and a higher net reduction in US tax credits related to
          decreased by US$397 million driven by the adoption of IFRS 16   Chilean taxes.
          where freight costs related to continuous voyage charters were   For more information on income tax expense,
          brought onto the balance sheet as right-of-use assets and   refer to note 6 ‘Income tax expense’ in section 5.
          depreciated. Depreciation and amortisation expense increased
          by US$283 million driven by the adoption of IFRS 16 right-of-use
          assets partially offset by lower depreciation and amortisation at
          Petroleum in line with lower production volumes due to natural
          field decline. Impairment of assets increased by US$230 million


          96  BHP Annual Report 2020