
Page 99 - Annual Report 2020
P. 99
1
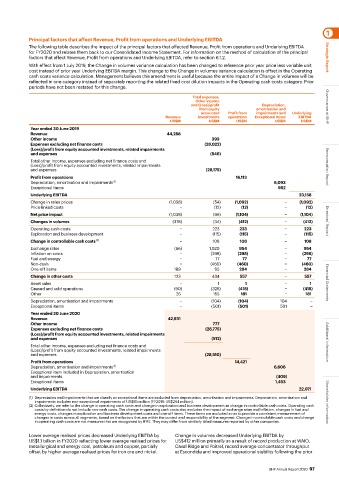
Principal factors that affect Revenue, Profit from operations and Underlying EBITDA
The following table describes the impact of the principal factors that affected Revenue, Profit from operations and Underlying EBITDA
for FY2020 and relates them back to our Consolidated Income Statement. For information on the method of calculation of the principal
factors that affect Revenue, Profit from operations and Underlying EBITDA, refer to section 6.1.2. Strategic Report
With effect from 1 July 2019, the Change in volumes variance calculation has been changed to reference prior year price less variable unit
cost instead of prior year Underlying EBITDA margin. This change to the Change in volumes variance calculation is offset in the Operating
cash costs variance calculation. Management believes this amendment is useful because the entire impact of a Change in volumes will be
reflected in one category instead of separately reporting the related fixed cost dilution impacts in the Operating cash costs category. Prior
periods have not been restated for this change.
Total expenses,
Other income
and (Loss)/profit Depreciation,
from equity amortisation and Governance at BHP
accounted Profit from impairments and Underlying
Revenue investments operations Exceptional Items EBITDA
US$M US$M US$M US$M US$M
Year ended 30 June 2019
Revenue 44,288
Other income 393
Expenses excluding net finance costs (28,022)
(Loss)/profit from equity accounted investments, related impairments
and expenses (546)
Total other income, expenses excluding net finance costs and
(Loss)/profit from equity accounted investments, related impairments Remuneration Report
and expenses (28,175)
Profit from operations 16,113
Depreciation, amortisation and impairments (1) 6,093
Exceptional items 952
Underlying EBITDA 23,158
Change in sales prices (1,038) (54) (1,092) − (1,092)
Price-linked costs – (12) (12) − (12)
Net price impact (1,038) (66) (1,104) − (1,104)
Changes in volumes (378) (34) (412) − (412) Directors’ Report
Operating cash costs − 223 223 − 223
Exploration and business development − (115) (115) − (115)
Change in controllable cash costs (2) − 108 108 − 108
Exchange rates (66) 1,020 954 − 954
Inflation on costs − (298) (298) − (298)
Fuel and energy − 77 77 − 77
Non-cash − (460) (460) − (460)
One-off items 189 95 284 − 284
Change in other costs 123 434 557 − 557
Asset sales − 1 1 − 1 Financial Statements
Ceased and sold operations (90) (328) (418) − (418)
Other 26 155 181 − 181
Depreciation, amortisation and impairments − (104) (104) 104 −
Exceptional items − (501) (501) 501 −
Year ended 30 June 2020
Revenue 42,931
Other income 777
Expenses excluding net finance costs (28,775)
(Loss)/profit from equity accounted investments, related impairments
and expenses (512)
Total other income, expenses excluding net finance costs and Additional information
(Loss)/profit from equity accounted investments, related impairments
and expenses (28,510)
Profit from operations 14,421
(1)
Depreciation, amortisation and impairments 6,606
Exceptional item included in Depreciation, amortisation
and impairments (409)
Exceptional items 1,453
Underlying EBITDA 22,071
(1) Depreciation and impairments that we classify as exceptional items are excluded from depreciation, amortisation and impairments. Depreciation, amortisation and
impairments includes non-exceptional impairments of US$85 million (FY2019: US$264 million). Shareholder information
(2) Collectively, we refer to the change in operating cash costs and change in exploration and business development as change in controllable cash costs. Operating cash
costs by definition do not include non-cash costs. The change in operating cash costs also excludes the impact of exchange rates and inflation, changes in fuel and
energy costs, changes in exploration and business development costs and one-off items. These items are excluded so as to provide a consistent measurement of
changes in costs across all segments, based on the factors that are within the control and responsibility of the segment. Change in controllable cash costs and change
in operating cash costs are not measures that are recognised by IFRS. They may differ from similarly titled measures reported by other companies.
Lower average realised prices decreased Underlying EBITDA by Change in volumes decreased Underlying EBITDA by
US$1.1 billion in FY2020 reflecting lower average realised prices for US$412 million primarily as a result of record production at WAIO,
metallurgical and energy coal, petroleum and copper, partially Caval Ridge and Poitrel, record average concentrator throughput
offset by higher average realised prices for iron ore and nickel. at Escondida and improved operational stability following the prior
BHP Annual Report 2020 97