
Page 97 - Annual Report 2020
P. 97
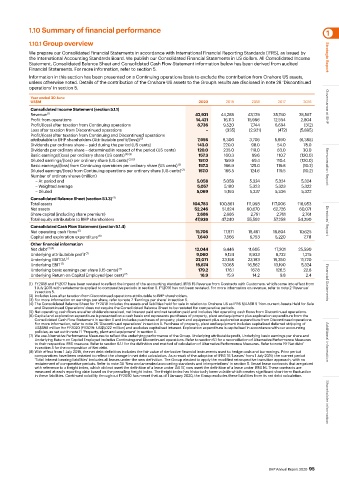
1.10 Summary of financial performance                                                                    1

           1.10.1 Group overview

           We prepare our Consolidated Financial Statements in accordance with International Financial Reporting Standards (IFRS), as issued by
           the International Accounting Standards Board. We publish our Consolidated Financial Statements in US dollars. All Consolidated Income   Strategic Report
           Statement, Consolidated Balance Sheet and Consolidated Cash Flow Statement information below has been derived from audited
           Financial Statements. For more information, refer to section 5.
           Information in this section has been presented on a Continuing operations basis to exclude the contribution from Onshore US assets,
           unless otherwise noted. Details of the contribution of the Onshore US assets to the Group’s results are disclosed in note 28 ‘Discontinued
           operations’ in section 5.

            Year ended 30 June
            US$M                                                       2020     2019     2018      2017     2016
            Consolidated Income Statement (section 5.1.1)                                                           Governance at BHP
            Revenue                                                   42,931   44,288   43,129   35,740   28,567
                  (1)
            Profit from operations                                    14,421    16,113  15,996   12,554    2,804
            Profit/(loss) after taxation from Continuing operations   8,736    9,520     7,744    6,694     (312)
            Loss after taxation from Discontinued operations              −     (335)   (2,921)    (472)  (5,895)
            Profit/(loss) after taxation from Continuing and Discontinued operations
            attributable to BHP shareholders (Attributable profit/(loss))  (2)  7,956  8,306  3,705  5,890  (6,385)
            Dividends per ordinary share – paid during the period (US cents)  143.0  220.0  98.0  54.0      78.0
            Dividends per ordinary share – determined in respect of the period (US cents)  120.0  235.0  118.0  83.0  30.0
            Basic earnings/(loss) per ordinary share (US cents)  (2) (3)  157.3  160.3   69.6     110.7   (120.0)
            Diluted earnings/(loss) per ordinary share (US cents)  (2) (3)  157.0  159.9  69.4    110.4   (120.0)
            Basic earnings/(loss) from Continuing operations per ordinary share (US cents)  (3)  157.3  166.9  125.0  119.8  (10.2)  Remuneration Report
            Diluted earnings/(loss) from Continuing operations per ordinary share (US cents)  (3)  157.0  166.5  124.6  119.5  (10.2)
            Number of ordinary shares (million)
             – At period end                                          5,058    5,058     5,324    5,324    5,324
             – Weighted average                                       5,057     5,180    5,323    5,323    5,322
             – Diluted                                                5,069     5,193    5,337    5,336    5,322
            Consolidated Balance Sheet (section 5.1.3)  (4)
            Total assets                                             104,783  100,861   111,993  117,006  118,953
            Net assets                                               52,246    51,824   60,670   62,726   60,071
            Share capital (including share premium)                   2,686     2,686    2,761    2,761    2,761
            Total equity attributable to BHP shareholders            47,936    47,240   55,592   57,258   54,290    Directors’ Report
            Consolidated Cash Flow Statement (section 5.1.4)
            Net operating cash flows  (5)                             15,706    17,871  18,461   16,804   10,625
            Capital and exploration expenditure  (6)                  7,640     7,566    6,753    5,220     7,711
            Other financial information
            Net debt  (7) (8)                                        12,044    9,446    11,605   17,201   25,590
            Underlying attributable profit  (7)                       9,060     9,124    8,933    6,732    1,215
            Underlying EBITDA  (7)                                    22,071   23,158   23,183   19,350    11,720
            Underlying EBIT  (7)                                      15,874   17,065   16,562   13,190    5,324
            Underlying basic earnings per share (US cents)  (7)        179.2    176.1    167.8    126.5     22.8
            Underlying Return on Capital Employed (per cent)  (7)      16.9      15.9     14.2     9.8      2.4
           (1)  FY2018 and FY2017 have been restated to reflect the impact of the accounting standard, IFRS 15 Revenue from Contracts with Customers, which came into effect from   Financial Statements
             1 July 2018 with restatements applied to comparative periods in section 5. FY2016 has not been restated. For more information on revenue, refer to note 2 ‘Revenue’
             in section 5.
           (2) Includes Loss after taxation from Discontinued operations attributable to BHP shareholders.
           (3) For more information on earnings per share, refer to note 7 ‘Earnings per share’ in section 5.
           (4) The Consolidated Balance Sheet for FY2018 includes the assets and liabilities held for sale in relation to Onshore US as IFRS 5/AASB 5 ‘Non-current Assets Held for Sale
             and Discontinued Operations’ does not require the Consolidated Balance Sheet to be restated for comparative periods.
           (5) Net operating cash flows are after dividends received, net interest paid and net taxation paid and includes Net operating cash flows from Discontinued operations.
           (6)  Capital and exploration expenditure is presented on a cash basis and represents purchases of property, plant and equipment plus exploration expenditure from the
             Consolidated Cash Flow Statement in section 5 and includes purchases of property, plant and equipment plus exploration expenditure from Discontinued operations.
             For more information, refer to note 28 ‘Discontinued operations’ in section 5. Purchase of property, plant and equipment includes capitalised deferred stripping of
             US$698 million for FY2020 (FY2019: US$1,022 million) and excludes capitalised interest. Exploration expenditure is capitalised in accordance with our accounting
             policies, as set out in note 11 ‘Property, plant and equipment’ in section 5.
           (7) We use Alternative Performance Measures to reflect the underlying performance of the Group. Underlying attributable profit, Underlying basic earnings per share and
             Underlying Return on Capital Employed includes Continuing and Discontinued operations. Refer to section 6.1 for a reconciliation of Alternative Performance Measures
             to their respective IFRS measure. Refer to section 6.1.1 for the definition and method of calculation of Alternative Performance Measures. Refer to note 19 ‘Net debt’    Additional information
             in section 5 for the composition of Net debt.
           (8) With effect from 1 July 2019, the net debt definition includes the fair value of derivative financial instruments used to hedge cash and borrowings. Prior period
             comparatives have been restated to reflect the change in net debt calculation. As a result of the adoption of IFRS 16 ‘Leases’ from 1 July 2019, the current period
             ‘Total Interest bearing liabilities’ includes all leases under the new definition. The Group elected to apply the modified retrospective transition approach, with no
             restatement of comparative periods. Refer to note 38 ‘New and amended accounting standards and interpretations’ in section 5. Vessel lease contracts that are priced
             with reference to a freight index, which did not meet the definition of a lease under IAS 17, now meet the definition of a lease under IFRS 16. These contracts are
             measured at each reporting date based on the prevailing freight index. The freight index has historically been volatile which creates significant short-term fluctuation
             in these liabilities. Continued volatility throughout FY2020 has meant that as of 1 January 2020, the Group excludes these liabilities from its net debt calculation.  Shareholder information


                                                                                               BHP Annual Report 2020  95