
Page 100 - Annual Report 2020
P. 100
1.10.2 Financial results continued
period impacts of unplanned outages. These favourable A stronger US dollar against the Australian dollar and Chilean peso
movements were more than offset by the impacts from planned increased Underlying EBITDA by US$954 million during the period.
maintenance across a number of our assets (Queensland Coal, Non-cash reflects higher deferred stripping depletion and lower
WAIO), unfavourable weather (Queensland Coal, WAIO, NSWEC), overburden movement in line with mine plan at Escondida,
a change in product strategy at NSWEC to focus on higher-quality decreasing Underlying EBITDA by US$460 million.
products, lower grade at Escondida and Spence and Petroleum
natural field decline across the portfolio. Higher ceased and sold operations reflects higher closure and
Lower costs reflect strong cost performance driven by consumption rehabilitation provision adjustments for closed mines of
US$362 million, sale of our interests in the Bruce and Keith oil
efficiencies at Escondida, favourable inventory movements across and gas fields in the prior period, and cessation of operations
our assets in line with mine plans and planned rebuilds for operational at Minerva in FY2020.
stability following drawdowns in the prior year, supported by further
reductions in overheads, partially offset by increased planned Other includes the favourable impacts from the first year of
maintenance activities at a number of assets during the year. This application of IFRS 16 Leases offset by lower profits from our equity
was offset by higher business development costs in Mexico following accounted investments (Antamina and Cerrejón) due to lower
the successful exploration program at Trion. prices and COVID-19 related outages.
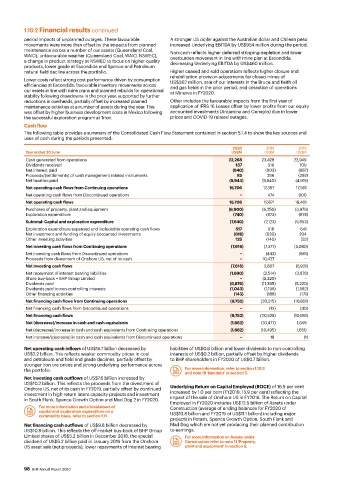
Cash flow
The following table provides a summary of the Consolidated Cash Flow Statement contained in section 5.1.4 to show the key sources and
uses of cash during the periods presented:
2020 2019 2018
Year ended 30 June US$M US$M US$M
Cash generated from operations 22,268 23,428 22,949
Dividends received 137 516 709
Net interest paid (840) (903) (887)
Proceeds/(settlements) of cash management related instruments 85 296 (292)
Net taxation paid (5,944) (5,940) (4,918)
Net operating cash flows from Continuing operations 15,706 17,397 17,561
Net operating cash flows from Discontinued operations − 474 900
Net operating cash flows 15,706 17,871 18,461
Purchases of property, plant and equipment (6,900) (6,250) (4,979)
Exploration expenditure (740) (873) (874)
Subtotal: Capital and exploration expenditure (7,640) (7,123) (5,853)
Exploration expenditure expensed and included in operating cash flows 517 516 641
Net investment and funding of equity accounted investments (618) (630) 204
Other investing activities 125 (140) (52)
Net investing cash flows from Continuing operations (7,616) (7,377) (5,060)
Net investing cash flows from Discontinued operations − (443) (861)
Proceeds from divestment of Onshore US, net of its cash − 10,427 −
Net investing cash flows (7,616) 2,607 (5,921)
Net repayment of interest bearing liabilities (1,690) (2,514) (3,878)
Share buy-back – BHP Group Limited − (5,220) −
Dividends paid (6,876) (11,395) (5,220)
Dividends paid to non-controlling interests (1,043) (1,198) (1,582)
Other financing activities (143) (188) (171)
Net financing cash flows from Continuing operations (9,752) (20,515) (10,851)
Net financing cash flows from Discontinued operations − (13) (40)
Net financing cash flows (9,752) (20,528) (10,891)
Net (decrease)/increase in cash and cash equivalents (1,662) (10,477) 1,649
Net (decrease)/increase in cash and cash equivalents from Continuing operations (1,662) (10,495) 1,650
Net increase/(decrease) in cash and cash equivalents from Discontinued operations − 18 (1)
Net operating cash inflows of US$15.7 billion decreased by liabilities of US$0.8 billion and lower dividends to non-controlling
US$2.2 billion. This reflects weaker commodity prices in coal interests of US$0.2 billion, partially offset by higher dividends
and petroleum and field and grade declines, partially offset by to BHP shareholders in FY2020 of US$0.7 billion.
stronger iron ore prices and strong underlying performance across
the portfolio. For more information, refer to section 1.10.3
and note 19 ‘Net debt’ in section 5.
Net investing cash outflows of US$7.6 billion increased by
US$10.2 billion. This reflects the proceeds from the divestment of
Onshore US, net of its cash in FY2019, partially offset by continued Underlying Return on Capital Employed (ROCE) of 16.9 per cent
investment in high-return latent capacity projects and investment increased by 1.0 per cent (FY2019: 15.9 per cent) reflecting the
in South Flank, Spence Growth Option and Mad Dog 2 in FY2020. impact of the sale of Onshore US in FY2018. The Return on Capital
Employed in FY2020 includes US$12.5 billion of Assets under
For more information and a breakdown of Construction (average of ending balances for FY2020 of
capital and exploration expenditure on a US$13.8 billion and FY2019 of US$11.1 billion) including major
commodity basis, refer to section 1.11.
projects in Potash, Spence Growth Option, South Flank and
Net financing cash outflows of US$9.8 billion decreased by Mad Dog which are not yet producing their planned contribution
US$10.8 billion. This reflects the off-market buy-back of BHP Group to earnings.
Limited shares of US$5.2 billion in December 2018, the special For more information on Assets under
dividend of US$5.2 billion paid in January 2019 from the Onshore Construction refer to note 11 ‘Property,
US asset sale (net proceeds), lower repayments of interest bearing plant and equipment’ in section 5.
98 BHP Annual Report 2020