
Page 107 - Annual Report 2020
P. 107
1.11.3 Iron Ore 1
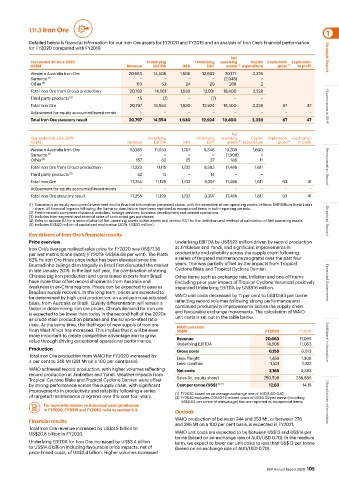
Detailed below is financial information for our Iron Ore assets for FY2020 and FY2019 and an analysis of Iron Ore’s financial performance
for FY2020 compared with FY2019.
Net Strategic Report
Year ended 30 June 2020 Underlying Underlying operating Capital Exploration Exploration
US$M Revenue EBITDA D&A EBIT assets (4) expenditure gross (5) to profit
Western Australia Iron Ore 20,663 14,508 1,606 12,902 20,177 2,326
Samarco (1) − − − − (2,045) −
Other (2) 119 53 24 29 268 2
Total Iron Ore from Group production 20,782 14,561 1,630 12,931 18,400 2,328
Third party products (3) 15 (7) − (7) − −
Total Iron Ore 20,797 14,554 1,630 12,924 18,400 2,328 87 47 Governance at BHP
Adjustment for equity accounted investments − − − − − − − −
Total Iron Ore statutory result 20,797 14,554 1,630 12,924 18,400 2,328 87 47
Net
Year ended 30 June 2019 Underlying Underlying operating Capital Exploration Exploration
US$M Revenue EBITDA D&A EBIT assets (4) expenditure gross (5) to profit
Western Australia Iron Ore 17,066 11,053 1,707 9,346 19,208 1,600
Samarco (1) − − − − (1,908) −
Other (2) 157 62 25 37 186 11
Total Iron Ore from Group production 17,223 11,115 1,732 9,383 17,486 1,611 Remuneration Report
Third party products (3) 32 14 − 14 − −
Total Iron Ore 17,255 11,129 1,732 9,397 17,486 1,611 93 41
Adjustment for equity accounted investments − − − − − − − −
Total Iron Ore statutory result 17,255 11,129 1,732 9,397 17,486 1,611 93 41
(1) Samarco is an equity accounted investment and its financial information presented above, with the exception of net operating assets, reflects BHP Billiton Brasil Ltda’s
share. All financial impacts following the Samarco dam failure have been reported as exceptional items in both reporting periods.
(2) Predominantly comprises divisional activities, towage services, business development and ceased operations.
(3) Includes inter-segment and external sales of contracted gas purchases.
(4) Refer to section 6.1 for a reconciliation of Net operating assets to Net assets and section 6.1.1 for the definition and method of calculation of Net operating assets. Directors’ Report
(5) Includes US$40 million of capitalised exploration (2019: US$52 million).
Key drivers of Iron Ore’s financial results
Price overview Underlying EBITDA by US$523 million driven by record production
Iron Ore’s average realised sales price for FY2020 was US$77.36 at Jimblebar and Yandi, and significant improvements in
per wet metric tonne (wmt) (FY2019: US$66.68 per wmt). The Platts productivity and reliability across the supply chain following
62% Fe Iron Ore Fines price index has been elevated since the a series of targeted maintenance programs over the past four
Brumadinho tailings dam tragedy in Brazil first disrupted the market years. This was partially offset by the impacts from Tropical
in late January 2019. In the last half year, the combination of strong Cyclone Blake and Tropical Cyclone Damien.
Chinese pig iron production and constrained exports from Brazil Other items such as exchange rate, inflation and one-off items
have more than offset record shipments from Australia and (including prior year impact of Tropical Cyclone Veronica) positively Financial Statements
weakness in ex-China regions. Prices can be expected to ease as impacted Underlying EBITDA by US$516 million.
Brazilian supply recovers. In the long term, prices are expected to
be determined by high cost production, on a value-in-use adjusted WAIO unit costs decreased by 11 per cent to US$12.63 per tonne
basis, from Australia or Brazil. Quality differentiation will remain a reflecting record volumes following strong performance and
factor in determining iron ore prices. China’s demand for iron ore continued productivity improvements across the supply chain
is expected to be lower than today in the second half of the 2020s and favourable exchange movements. The calculation of WAIO
as crude steel production plateaus and the scrap-to-steel ratio unit costs is set out in the table below.
rises. At the same time, the likelihood of new supply of iron ore
from West Africa has increased. This implies that it will be even WAIO unit costs FY2020 FY2019
US$M
more important to create competitive advantage and to grow
value through driving exceptional operational performance. Revenue 20,663 17,066 Additional information
Underlying EBITDA
14,508
11,053
Production Gross costs 6,155 6,013
Total Iron Ore production from WAIO for FY2020 increased by
4 per cent to 248 Mt (281 Mt on a 100 per cent basis). Less: freight 1,459 1,308
Less: royalties
1,531
1,322
WAIO achieved record production, with higher volumes reflecting Net costs 3,165 3,383
record production at Jimblebar and Yandi. Weather impacts from
Tropical Cyclone Blake and Tropical Cyclone Damien were offset Sales (kt, equity share) 250,598 238,836
by strong performance across the supply chain, with significant Cost per tonne (US$) (1) (2) 12.63 14.16
improvements in productivity and reliability following a series
of targeted maintenance programs over the past four years. (1) FY2020 based on an average exchange rate of AUD/USD 0.67.
(2) FY2020 excludes COVID-19 related costs of US$0.30 per tonne (including
For more information on individual asset production US$0.04 per tonne of demurrage) that are reported as exceptional items. Shareholder information
in FY2020, FY2019 and FY2018, refer to section 6.3. Outlook
Financial results WAIO production of between 244 and 253 Mt, or between 276
and 286 Mt on a 100 per cent basis, is expected in FY2021.
Total Iron Ore revenue increased by US$3.5 billion to
US$20.8 billion in FY2020. WAIO unit costs are expected to be between US$13 and US$14 per
tonne (based on an exchange rate of AUD/USD 0.70). In the medium
Underlying EBITDA for Iron Ore increased by US$3.4 billion term, we expect to lower our unit costs to less than US$13 per tonne
to US$14.6 billion including favourable price impacts, net of (based on an exchange rate of AUD/USD 0.70).
price-linked costs, of US$2.4 billion. Higher volumes increased
BHP Annual Report 2020 105