
Page 268 - Annual Report 2020
P. 268
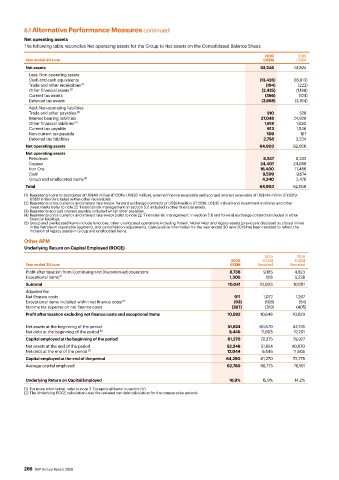
6.1 Alternative Performance Measures continued
          Net operating assets
          The following table reconciles Net operating assets for the Group to Net assets on the Consolidated Balance Sheet:

                                                                                              2020        2019
          Year ended 30 June                                                                  US$M       US$M
          Net assets                                                                        52,246      51,824
           Less: Non-operating assets
           Cash and cash equivalents                                                        (13,426)    (15,613)
           Trade and other receivables  (1)                                                   (194)       (222)
           Other financial assets  (2)                                                       (2,425)     (1,188)
           Current tax assets                                                                 (366)       (124)
           Deferred tax assets                                                               (3,688)     (3,764)
           Add: Non-operating liabilities
           Trade and other payables  (3)                                                       310        328
           Interest bearing liabilities                                                      27,048     24,828
           Other financial liabilities  (4)                                                   1,618      1,020
           Current tax payable                                                                 913       1,546
           Non-current tax payable                                                             109        187
           Deferred tax liabilities                                                           2,758      3,234
          Net operating assets                                                              64,903      62,056
          Net operating assets
           Petroleum                                                                         8,247       8,332
           Copper                                                                           24,407      24,088
           Iron Ore                                                                         18,400       17,486
           Coal                                                                              9,509       9,674
           Group and unallocated items  (5)                                                  4,340       2,476
          Total                                                                             64,903      62,056
          (1)  Represents loans to associates of US$40 million (FY2019: US$33 million), external finance receivable and accrued interest receivable of US$144 million (FY2019:
           US$51 million) included within other receivables.
          (2) Represents cross currency and interest rate swaps, forward exchange contracts of US$24 million (FY2019: US$35 million) and investment in shares and other
           investments (refer to note 22 ‘Financial risk management’ in section 5.1) included in other financial assets.
          (3) Represents accrued interest payable included within other payables.
          (4) Represents cross currency and interest rate swaps (refer to note 22 ‘Financial risk management’ in section 5.1) and forward exchange contracts included in other
           financial liabilities.
          (5) Group and unallocated items include functions, other unallocated operations including Potash, Nickel West and legacy assets (previously disclosed as closed mines
           in the Petroleum reportable segment), and consolidation adjustments. Comparative information for the year ended 30 June 2019 has been restated to reflect the
           inclusion of legacy assets in Group and unallocated items.
          Other APM
          Underlying Return on Capital Employed (ROCE)
                                                                                              2019       2018
                                                                                  2020       US$M        US$M
          Year ended 30 June                                                      US$M      Restated   Restated
          Profit after taxation from Continuing and Discontinued operations       8,736      9,185      4,823
          Exceptional items  (1)                                                  1,305        818       5,228
          Subtotal                                                               10,041     10,003      10,051
          Adjusted for:
          Net finance costs                                                        911        1,072      1,267
          Exceptional items included within net finance costs  (1)                 (93)       (108)       (84)
          Income tax expense on net finance costs                                 (267)       (319)      (405)
          Profit after taxation excluding net finance costs and exceptional items  10,592   10,648      10,829

          Net assets at the beginning of the period                              51,824     60,670      62,726
          Net debt at the beginning of the period  (2)                           9,446       11,605     17,201
          Capital employed at the beginning of the period                        61,270      72,275     79,927
          Net assets at the end of the period                                    52,246      51,824     60,670
          Net debt at the end of the period  (2)                                 12,044      9,446      11,605
          Capital employed at the end of the period                             64,290       61,270     72,275
          Average capital employed                                               62,780     66,773      76,101

          Underlying Return on Capital Employed                                   16.9%      15.9%      14.2%
          (1)  For more information, refer to note 3 ‘Exceptional items’ in section 5.1.
          (2) The Underlying ROCE calculation uses the restated net debt calculation for the comparative periods.


          266  BHP Annual Report 2020