Page 266 - Annual Report 2020
P. 266

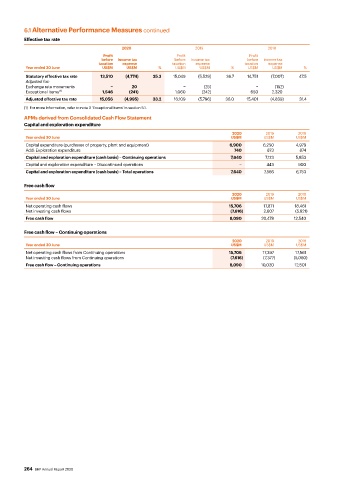
6.1 Alternative Performance Measures continued
          Effective tax rate
                                            2020                      2019                     2018
                                     Profit                    Profit                    Profit
                                     before   Income tax      before   Income tax       before   Income tax
                                    taxation   expense       taxation   expense        taxation   expense
          Year ended 30 June         US$M    US$M        %     US$M    US$M       %     US$M     US$M       %
          Statutory effective tax rate  13,510  (4,774)  35.3  15,049  (5,529)  36.7    14,751  (7,007)   47.5
          Adjusted for:
          Exchange rate movements        −     20                 −      (25)               −     (152)
          Exceptional items  (1)     1,546    (241)            1,060    (242)            650    2,320
          Adjusted effective tax rate    15,056  (4,995)  33.2  16,109  (5,796)  36.0   15,401  (4,839)   31.4
          (1)  For more information, refer to note 3 ‘Exceptional items’ in section 5.1.
          APMs derived from Consolidated Cash Flow Statement
          Capital and exploration expenditure

                                                                                   2020       2019        2018
          Year ended 30 June                                                      US$M        US$M       US$M
          Capital expenditure (purchases of property, plant and equipment)        6,900      6,250       4,979
          Add: Exploration expenditure                                             740         873        874
          Capital and exploration expenditure (cash basis) – Continuing operations  7,640     7,123      5,853
          Capital and exploration expenditure – Discontinued operations               −        443        900
          Capital and exploration expenditure (cash basis) – Total operations     7,640       7,566      6,753

          Free cash flow
                                                                                   2020       2019        2018
          Year ended 30 June                                                      US$M        US$M       US$M
          Net operating cash flows                                               15,706       17,871     18,461
          Net investing cash flows                                                (7,616)     2,607      (5,921)
          Free cash flow                                                          8,090      20,478     12,540

          Free cash flow – Continuing operations
                                                                                   2020       2019        2018
          Year ended 30 June                                                      US$M        US$M       US$M
          Net operating cash flows from Continuing operations                    15,706      17,397      17,561
          Net investing cash flows from Continuing operations                     (7,616)    (7,377)    (5,060)
          Free cash flow – Continuing operations                                  8,090      10,020      12,501


          264  BHP Annual Report 2020
   261   262   263   264   265   266   267   268   269   270   271