
Page 265 - Annual Report 2020
P. 265
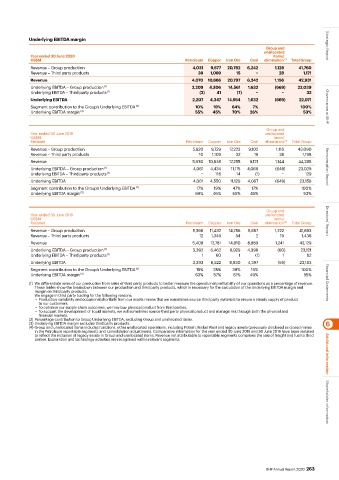
Underlying EBITDA margin
                                                                                              Group and             Strategic Report
                                                                                              unallocated
            Year ended 30 June 2020                                                              items/
            US$M                                                  Petroleum  Copper  Iron Ore  Coal  elimination  (4)  Total Group
            Revenue – Group production                               4,031  9,577  20,782  6,242  1,128   41,760
            Revenue – Third party products                             39  1,089    15      −      28       1,171
            Revenue                                                 4,070  10,666  20,797  6,242  1,156   42,931
            Underlying EBITDA – Group production  (1)               2,209  4,306  14,561  1,632   (669)   22,039
            Underlying EBITDA – Third party products  (1)              (2)   41     (7)     −        −       32
            Underlying EBITDA                                        2,207  4,347  14,554  1,632  (669)   22,071
            Segment contribution to the Group’s Underlying EBITDA  (2)  10%  19%  64%     7%               100%     Governance at BHP
            Underlying EBITDA margin  (3)                             55%   45%    70%   26%               53%


                                                                                               Group and
            Year ended 30 June 2019                                                           unallocated
            US$M                                                                                 items/
            Restated                                              Petroleum  Copper  Iron Ore  Coal  elimination  (4)  Total Group
            Revenue – Group production                               5,920  9,729  17,223  9,102  1,116   43,090
            Revenue – Third party products                             10  1,109    32    19       28      1,198
            Revenue                                                  5,930  10,838  17,255  9,121  1,144  44,288
            Underlying EBITDA – Group production                     4,061  4,434  11,115  4,068  (649)   23,029    Remuneration Report
                                      (1)
            Underlying EBITDA – Third party products  (1)               −    116    14     (1)       −      129
            Underlying EBITDA                                        4,061  4,550  11,129  4,067  (649)   23,158
            Segment contribution to the Group’s Underlying EBITDA  (2)  17%  19%   47%   17%               100%
            Underlying EBITDA margin  (3)                             69%   46%    65%   45%                53%


                                                                                               Group and
            Year ended 30 June 2018                                                           unallocated
            US$M                                                                                 items/
            Restated                                              Petroleum  Copper  Iron Ore  Coal  elimination  (4)  Total Group  Directors’ Report
            Revenue – Group production                               5,396  11,432  14,756  8,887  1,222  41,693
            Revenue – Third party products                             12  1,349    54     2       19      1,436
            Revenue                                                  5,408  12,781  14,810  8,889  1,241  43,129
            Underlying EBITDA – Group production  (1)                3,392  6,462  8,929  4,398    (60)    23,121
            Underlying EBITDA – Third party products  (1)               1    60      1     (1)      1        62
            Underlying EBITDA                                        3,393  6,522  8,930  4,397    (59)   23,183
            Segment contribution to the Group’s Underlying EBITDA  (2)  15%  28%   38%   19%               100%
            Underlying EBITDA margin  (3)                             63%   57%    61%   49%                55%
           (1)  We differentiate sales of our production from sales of third party products to better measure the operational profitability of our operations as a percentage of revenue.   Financial Statements
             These tables show the breakdown between our production and third party products, which is necessary for the calculation of the Underlying EBITDA margin and
             margin on third party products.
              We engage in third party trading for the following reasons:
             •  Production variability and occasional shortfalls from our assets means that we sometimes source third party materials to ensure a steady supply of product
               to our customers.
             •  To optimise our supply chain outcomes, we may buy physical product from third parties.
             •  To support the development of liquid markets, we will sometimes source third party physical product and manage risk through both the physical and
               financial markets.
           (2) Percentage contribution to Group Underlying EBITDA, excluding Group and unallocated items.
           (3) Underlying EBITDA margin excludes third party products.                                             6
           (4) Group and unallocated items includes functions, other unallocated operations, including Potash, Nickel West and legacy assets (previously disclosed as closed mines
             in the Petroleum reportable segment), and consolidation adjustments. Comparative information for the year ended 30 June 2019 and 30 June 2018 have been restated
             to reflect the inclusion of legacy assets in Group and unallocated items. Revenue not attributable to reportable segments comprises the sale of freight and fuel to third
             parties. Exploration and technology activities are recognised within relevant segments.                Additional information


                                                                                                                    Shareholder information


                                                                                              BHP Annual Report 2020  263