
Page 267 - Annual Report 2020
P. 267
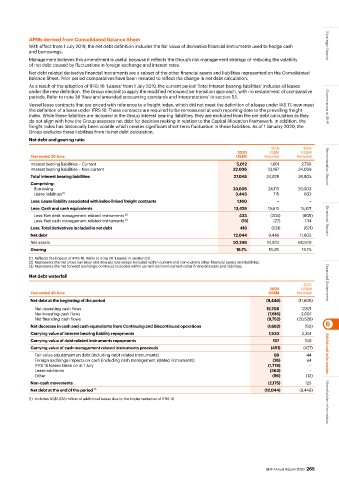
APMs derived from Consolidated Balance Sheet
           With effect from 1 July 2019, the net debt definition includes the fair value of derivative financial instruments used to hedge cash    Strategic Report
           and borrowings.
           Management believes this amendment is useful because it reflects the Group’s risk management strategy of reducing the volatility
           of net debt caused by fluctuations in foreign exchange and interest rates.
           Net debt related derivative financial instruments are a subset of the other financial assets and liabilities represented on the Consolidated
           Balance Sheet. Prior period comparatives have been restated to reflect the change in net debt calculation.
           As a result of the adoption of IFRS 16 ‘Leases’ from 1 July 2019, the current period ‘Total Interest bearing liabilities’ includes all leases
           under the new definition. The Group elected to apply the modified retrospective transition approach, with no restatement of comparative
           periods. Refer to note 38 ‘New and amended accounting standards and interpretations’ in section 5.1.
           Vessel lease contracts that are priced with reference to a freight index, which did not meet the definition of a lease under IAS 17, now meet
           the definition of a lease under IFRS 16. These contracts are required to be remeasured at each reporting date to the prevailing freight   Governance at BHP
           index. While these liabilities are included in the Group interest bearing liabilities, they are excluded from the net debt calculation as they
           do not align with how the Group assesses net debt for decision making in relation to the Capital Allocation Framework. In addition, the
           freight index has historically been volatile which creates significant short-term fluctuation in these liabilities. As of 1 January 2020, the
           Group excludes these liabilities from its net debt calculation.
           Net debt and gearing ratio
                                                                                                2019        2018
                                                                                    2020       US$M        US$M
            Year ended 30 June                                                      US$M      Restated   Restated
            Interest bearing liabilities – Current                                  5,012       1,661      2,736
            Interest bearing liabilities – Non current                             22,036      23,167     24,069    Remuneration Report
            Total interest bearing liabilities                                     27,048      24,828     26,805
            Comprising:
             Borrowing                                                             23,605      24,113     26,003
             Lease liabilities  (1)                                                 3,443        715        802
            Less: Lease liability associated with index-linked freight contracts    1,160          −          −
            Less: Cash and cash equivalents                                        13,426      15,613      15,871
             Less: Net debt management related instruments  (2)                      433        (204)      (805)
             Less: Net cash management related instruments  (3)                       (15)       (27)       134     Directors’ Report
            Less: Total derivatives included in net debt                             418        (231)       (671)
            Net debt                                                               12,044      9,446      11,605
            Net assets                                                             52,246      51,824     60,670
            Gearing                                                                 18.7%      15.4%       16.1%
           (1)  Reflects the impact of IFRS 16. Refer to note 20 ‘Leases’ in section 5.1.
           (2)  Represents the net cross currency and interest rate swaps included within current and non-current other financial assets and liabilities.
           (3)  Represents the net forward exchange contracts included within current and non-current other financial assets and liabilities.
           Net debt waterfall
                                                                                                            2019    Financial Statements
                                                                                                2020       US$M
            Year ended 30 June                                                                 US$M      Restated
            Net debt at the beginning of the period                                            (9,446)    (11,605)
              Net operating cash flows                                                         15,706      17,871
              Net investing cash flows                                                         (7,616)     2,607
              Net financing cash flows                                                         (9,752)   (20,528)
            Net decrease in cash and cash equivalents from Continuing and Discontinued operations  (1,662)  (50)   6
            Carrying value of interest bearing liability repayments                            1,533       2,351
            Carrying value of debt related instruments repayments                                157        160
            Carrying value of cash management related instruments proceeds                      (451)       (427)
              Fair value adjustment on debt (including debt related instruments)                 88          44     Additional information
              Foreign exchange impacts on cash (including cash management related instruments)   (26)        94
              IFRS 16 leases taken on at 1 July                                                (1,778)        −
              Lease additions                                                                   (363)         −
              Other                                                                              (96)        (13)
            Non-cash movements                                                                 (2,175)      125
            Net debt at the end of the period  (1)                                            (12,044)    (9,446)
           (1)  Includes US$1,633 million of additional leases due to the implementation of IFRS 16.                Shareholder information


                                                                                               BHP Annual Report 2020  265