
Page 262 - Annual Report 2020
P. 262
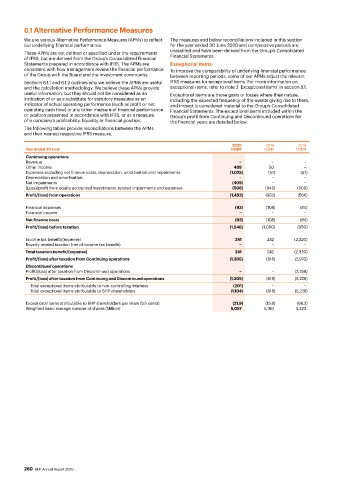
6.1 Alternative Performance Measures

          We use various Alternative Performance Measures (APMs) to reflect   The measures and below reconciliations included in this section
          our underlying financial performance.              for the year ended 30 June 2020 and comparative periods are
          These APMs are not defined or specified under the requirements    unaudited and have been derived from the Group’s Consolidated
          of IFRS, but are derived from the Group’s Consolidated Financial   Financial Statements.
          Statements prepared in accordance with IFRS. The APMs are   Exceptional items
          consistent with how management review the financial performance    To improve the comparability of underlying financial performance
          of the Group with the Board and the investment community.   between reporting periods, some of our APMs adjust the relevant
          Sections 6.1.1 and 6.1.2 outlines why we believe the APMs are useful   IFRS measures for exceptional items. For more information on
          and the calculation methodology. We believe these APMs provide   exceptional items, refer to note 3 ‘Exceptional items’ in section 5.1.
          useful information, but they should not be considered as an   Exceptional items are those gains or losses where their nature,
          indication of or as a substitute for statutory measures as an   including the expected frequency of the events giving rise to them,
          indicator of actual operating performance (such as profit or net   and impact is considered material to the Group’s Consolidated
          operating cash flow) or any other measure of financial performance   Financial Statements. The exceptional items included within the
          or position presented in accordance with IFRS, or as a measure    Group’s profit from Continuing and Discontinued operations for
          of a company’s profitability, liquidity or financial position.  the financial years are detailed below.
          The following tables provide reconciliations between the APMs
          and their nearest respective IFRS measure.

                                                                                   2020       2019        2018
          Year ended 30 June                                                      US$M        US$M       US$M
          Continuing operations
          Revenue                                                                     −          −          −
          Other income                                                             489         50           −
          Expenses excluding net finance costs, depreciation, amortisation and impairments  (1,025)  (57)  (57)
          Depreciation and amortisation                                               −          −          −
          Net impairments                                                          (409)         −          −
          (Loss)/profit from equity accounted investments, related impairments and expenses  (508)  (945)  (509)
          Profit/(loss) from operations                                           (1,453)     (952)       (566)

          Financial expenses                                                        (93)      (108)       (84)
          Financial income                                                            −          −          −
          Net finance costs                                                         (93)      (108)       (84)
          Profit/(loss) before taxation                                           (1,546)    (1,060)     (650)

          Income tax benefit/(expense)                                              241        242      (2,320)
          Royalty-related taxation (net of income tax benefit)                        −          −          −
          Total taxation benefit/(expense)                                          241        242      (2,320)
          Profit/(loss) after taxation from Continuing operations                 (1,305)      (818)    (2,970)
          Discontinued operations
          Profit/(loss) after taxation from Discontinued operations                   −          −       (2,258)
          Profit/(loss) after taxation from Continuing and Discontinued operations  (1,305)    (818)     (5,228)
            Total exceptional items attributable to non-controlling interests      (201)         −          −
            Total exceptional items attributable to BHP shareholders              (1,104)      (818)     (5,228)

          Exceptional items attributable to BHP shareholders per share (US cents)  (21.9)     (15.8)     (98.2)
          Weighted basic average number of shares (Million)                       5,057       5,180      5,323


          260  BHP Annual Report 2020