
Page 259 - Annual Report 2020
P. 259
5.7 Supplementary oil and gas information – unaudited continued
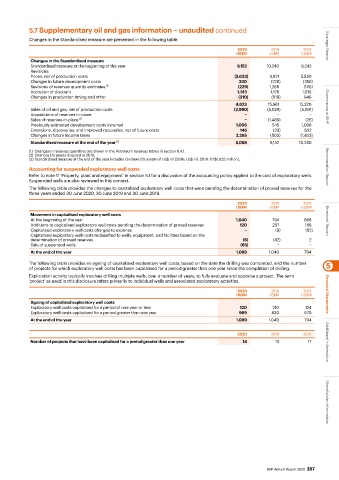
Changes in the Standardised measure are presented in the following table.
2020 2019 2018 Strategic Report
US$M US$M US$M
Changes in the Standardised measure
Standardised measure at the beginning of the year 9,152 10,240 8,242
Revisions:
Prices, net of production costs (5,633) 3,821 5,540
Changes in future development costs 330 (228) (358)
Revisions of reserves quantity estimates (1) (229) 1,268 (166)
Accretion of discount 1,313 1,178 1,016
Changes in production timing and other (310) (618) 946
4,623 15,661 15,220
Sales of oil and gas, net of production costs (2,980) (5,029) (5,091) Governance at BHP
Acquisitions of reserves-in-place − − −
Sales of reserves-in-place (2) − (1,489) (26)
Previously estimated development costs incurred 1,005 545 1,068
Extensions, discoveries, and improved recoveries, net of future costs 145 (33) 502
Changes in future income taxes 2,265 (503) (1,433)
Standardised measure at the end of the year (3) 5,058 9,152 10,240
(1) Changes in reserves quantities are shown in the Petroleum reserves tables in section 6.4.1.
(2) Onshore US assets disposal in 2019.
(3) Standardised measure at the end of the year includes Onshore US assets of US$ nil (2019: US$ nil; 2018: US$1,932 million).
Accounting for suspended exploratory well costs Remuneration Report
Refer to note 11 ‘Property, plant and equipment’ in section 5.1 for a discussion of the accounting policy applied to the cost of exploratory wells.
Suspended wells are also reviewed in this context.
The following table provides the changes to capitalised exploratory well costs that were pending the determination of proved reserves for the
three years ended 30 June 2020, 30 June 2019 and 30 June 2018.
2020 2019 2018
US$M US$M US$M
Movement in capitalised exploratory well costs
At the beginning of the year 1,040 794 668 Directors’ Report
Additions to capitalised exploratory well costs pending the determination of proved reserves 120 297 186
Capitalised exploratory well costs charged to expense − (9) (62)
Capitalised exploratory well costs reclassified to wells, equipment, and facilities based on the
determination of proved reserves (6) (42) 2
Sale of suspended wells (65) − −
At the end of the year 1,089 1,040 794
The following table provides an ageing of capitalised exploratory well costs, based on the date the drilling was completed, and the number 5
of projects for which exploratory well costs has been capitalised for a period greater than one year since the completion of drilling.
Exploration activity typically involves drilling multiple wells, over a number of years, to fully evaluate and appraise a project. The term
‘project’ as used in this disclosure refers primarily to individual wells and associated exploratory activities.
2020 2019 2018
US$M US$M US$M Financial Statements
Ageing of capitalised exploratory well costs
Exploratory well costs capitalised for a period of one year or less 120 210 124
Exploratory well costs capitalised for a period greater than one year 969 830 670
At the end of the year 1,089 1,040 794
2020 2019 2018
Number of projects that have been capitalised for a period greater than one year 14 13 17 Additional information
Shareholder information
BHP Annual Report 2020 257