
Page 256 - Annual Report 2020
P. 256
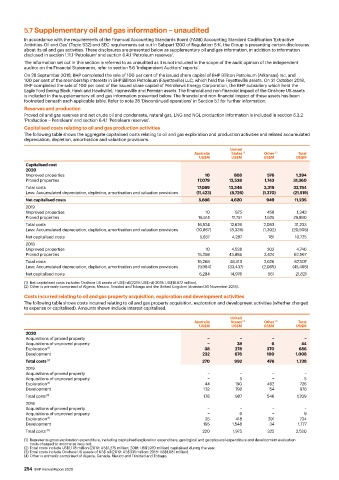
5.7 Supplementary oil and gas information – unaudited

          In accordance with the requirements of the Financial Accounting Standards Board (FASB) Accounting Standard Codification ‘Extractive
          Activities-Oil and Gas’ (Topic 932) and SEC requirements set out in Subpart 1200 of Regulation S-K, the Group is presenting certain disclosures
          about its oil and gas activities. These disclosures are presented below as supplementary oil and gas information, in addition to information
          disclosed in section 1.11.1 ‘Petroleum’ and section 6.4.1 ‘Petroleum reserves’.
          The information set out in this section is referred to as unaudited as it is not included in the scope of the audit opinion of the independent
          auditor on the Financial Statements, refer to section 5.6 ‘Independent Auditors’ reports’.
          On 28 September 2018, BHP completed the sale of 100 per cent of the issued share capital of BHP Billiton Petroleum (Arkansas) Inc. and
          100 per cent of the membership interests in BHP Billiton Petroleum (Fayetteville) LLC, which held the Fayetteville assets. On 31 October 2018,
          BHP completed the sale of 100 per cent of the issued share capital of Petrohawk Energy Corporation, the BHP subsidiary which held the
          Eagle Ford (being Black Hawk and Hawkville), Haynesville and Permian assets. The financial and non-financial impact of the Onshore US assets
          is included in the supplementary oil and gas information presented below. The financial and non-financial impact of these assets has been
          footnoted beneath each applicable table. Refer to note 28 ‘Discontinued operations’ in Section 5.1 for further information.
          Reserves and production
          Proved oil and gas reserves and net crude oil and condensate, natural gas, LNG and NGL production information is included in section 6.3.2
          ‘Production – Petroleum’ and section 6.4.1 ‘Petroleum reserves’.
          Capitalised costs relating to oil and gas production activities
          The following table shows the aggregate capitalised costs relating to oil and gas exploration and production activities and related accumulated
          depreciation, depletion, amortisation and valuation provisions.
                                                                                  United
                                                                     Australia    States  (1)  Other  (2)  Total
                                                                       US$M       US$M        US$M       US$M
          Capitalised cost
          2020
          Unproved properties                                            10        808         576       1,394
          Proved properties                                           17,079      12,538      1,743     31,360
          Total costs                                                 17,089     13,346       2,319     32,754
          Less: Accumulated depreciation, depletion, amortisation and valuation provisions  (11,423)  (8,726)  (1,370)  (21,519)
          Net capitalised costs                                        5,666      4,620        949       11,235
          2019
          Unproved properties                                            10         875        458       1,343
          Proved properties                                            16,514      11,751     1,625     29,890
          Total costs                                                 16,524      12,626      2,083     31,233
          Less: Accumulated depreciation, depletion, amortisation and valuation provisions  (10,867)  (8,339)  (1,302)  (20,508)
          Net capitalised costs                                        5,657      4,287        781       10,725
          2018
          Unproved properties                                            10       4,528        202       4,740
          Proved properties                                           16,258     43,885       2,424     62,567
          Total costs                                                 16,268      48,413      2,626     67,307
          Less: Accumulated depreciation, depletion, amortisation and valuation provisions  (9,984)  (33,437)  (2,065)  (45,486)
          Net capitalised costs                                        6,284      14,976       561       21,821
          (1)  Net capitalised costs includes Onshore US assets of US$ nil (2019: US$ nil; 2018: US$10,672 million).
          (2) Other is primarily comprised of Algeria, Mexico, Trinidad and Tobago and the United Kingdom (divested 30 November 2018).
          Costs incurred relating to oil and gas property acquisition, exploration and development activities
          The following table shows costs incurred relating to oil and gas property acquisition, exploration and development activities (whether charged
          to expense or capitalised). Amounts shown include interest capitalised.
                                                                                  United
                                                                     Australia    States  (3)  Other  (4)  Total
                                                                       US$M       US$M        US$M       US$M
          2020
          Acquisitions of proved property                                  −          −          −           −
          Acquisitions of unproved property                                −        38          6          44
          Exploration  (1)                                               38         278        370        686
          Development                                                   232        676         100       1,008
          Total costs  (2)                                              270        992         476       1,738
          2019
          Acquisitions of proved property                                  −          −          −           −
          Acquisitions of unproved property                                −         5           −          5
          Exploration  (1)                                               44         190        492        726
          Development                                                   132         792         54        978
          Total costs  (2)                                               176        987        546       1,709
          2018
          Acquisitions of proved property                                  −          −          −           −
          Acquisitions of unproved property                                −         9           −          9
          Exploration  (1)                                               25         418        291        734
          Development                                                   195        1,548        34        1,777
          Total costs  (2)                                              220        1,975       325       2,520
          (1)  Represents gross exploration expenditure, including capitalised exploration expenditure, geological and geophysical expenditure and development evaluation
           costs charged to income as incurred.
          (2) Total costs include US$1,178 million (2019: US$1,275 million; 2018: US$1,970 million) capitalised during the year.
          (3) Total costs include Onshore US assets of US$ nil (2019: US$331 million; 2018: US$1,081 million).
          (4) Other is primarily comprised of Algeria, Canada, Mexico and Trinidad and Tobago.
          254  BHP Annual Report 2020