
Page 257 - Annual Report 2020
P. 257
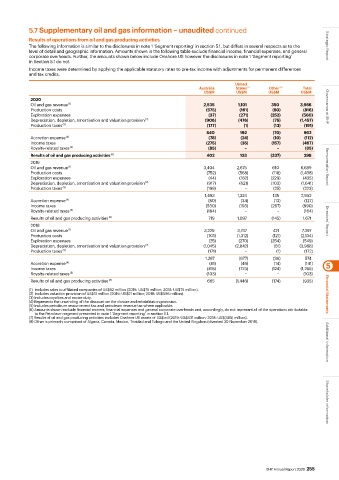
5.7 Supplementary oil and gas information – unaudited continued
           Results of operations from oil and gas producing activities
           The following information is similar to the disclosures in note 1 ‘Segment reporting’ in section 5.1, but differs in several respects as to the    Strategic Report
           level of detail and geographic information. Amounts shown in the following table exclude financial income, financial expenses, and general
           corporate overheads. Further, the amounts shown below include Onshore US however the disclosures in note 1 ‘Segment reporting’
           in Section 5.1 do not.
           Income taxes were determined by applying the applicable statutory rates to pre-tax income with adjustments for permanent differences
           and tax credits.
                                                                                    United
                                                                       Australia    States  (7)  Other  (8)  Total
                                                                         US$M       US$M       US$M        US$M
            2020
            Oil and gas revenue  (1)                                     2,535       1,101      350       3,986
            Production costs                                             (575)       (161)       (80)       (816)   Governance at BHP
            Exploration expenses                                          (37)       (271)      (252)      (560)
            Depreciation, depletion, amortisation and valuation provision  (2)  (906)  (476)     (75)     (1,457)
            Production taxes  (3)                                         (177)        (1)       (13)       (191)
                                                                          840        192         (70)       962
            Accretion expense  (4)                                        (78)        (24)       (10)       (112)
            Income taxes                                                 (275)       (35)       (157)      (467)
            Royalty-related taxes  (5)                                    (85)          −          −        (85)
            Results of oil and gas producing activities  (6)              402        133        (237)       298
            2019
            Oil and gas revenue  (1)                                     3,404      2,675        610       6,689    Remuneration Report
            Production costs                                              (752)      (568)       (118)     (1,438)
            Exploration expenses                                          (44)       (162)      (229)      (435)
            Depreciation, depletion, amortisation and valuation provision  (2)  (917)  (621)    (103)      (1,641)
            Production taxes  (3)                                         (198)         −        (25)       (223)
                                                                         1,493      1,324        135       2,952
            Accretion expense  (4)                                        (80)        (34)       (13)       (127)
            Income taxes                                                 (530)       (193)      (267)      (990)
            Royalty-related taxes  (5)                                    (164)         −          −        (164)
            Results of oil and gas producing activities  (6)              719       1,097       (145)      1,671
            2018                                                                                                    Directors’ Report
            Oil and gas revenue  (1)                                     3,229      3,747        421       7,397
            Production costs                                              (701)     (1,312)      (121)     (2,134)
            Exploration expenses                                          (25)       (270)      (254)      (549)
            Depreciation, depletion, amortisation and valuation provision  (2)  (1,045)  (2,842)  (81)    (3,968)
            Production taxes  (3)                                         (171)         −         (1)       (172)
                                                                         1,287       (677)       (36)       574
            Accretion expense  (4)                                         (81)       (46)       (14)       (141)   5
            Income taxes                                                  (418)      (723)      (124)      (1,265)
            Royalty-related taxes  (5)                                    (103)         −          −        (103)
            Results of oil and gas producing activities  (6)              685       (1,446)      (174)     (935)
           (1)  Includes sales to affiliated companies of US$62 million (2019: US$75 million; 2018: US$75 million).
           (2) Includes valuation provision of US$12 million (2019: US$21 million; 2018: US$596 million).           Financial Statements
           (3) Includes royalties and excise duty.
           (4) Represents the unwinding of the discount on the closure and rehabilitation provision.
           (5) Includes petroleum resource rent tax and petroleum revenue tax where applicable.
           (6) Amounts shown exclude financial income, financial expenses and general corporate overheads and, accordingly, do not represent all of the operations attributable
             to the Petroleum segment presented in note 1 ‘Segment reporting’ in section 5.1.
           (7) Results of oil and gas producing activities includes Onshore US assets of US$ nil (2019: US$431 million; 2018: US$(465) million).
           (8) Other is primarily comprised of Algeria, Canada, Mexico, Trinidad and Tobago and the United Kingdom (divested 30 November 2018).  Additional information


                                                                                               BHP Annual Report 2020  255  Shareholder information