
Page 225 - Annual Report 2020
P. 225
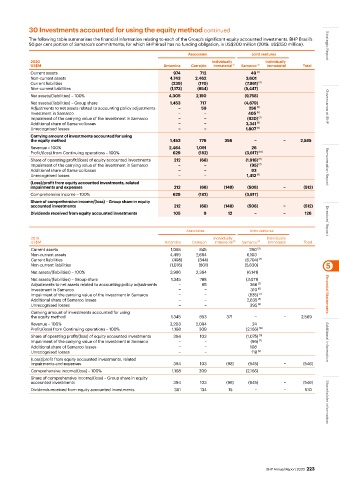
30 Investments accounted for using the equity method continued
           The following table summarises the financial information relating to each of the Group’s significant equity accounted investments. BHP Brasil’s
           50 per cent portion of Samarco’s commitments, for which BHP Brasil has no funding obligation, is US$200 million (2019: US$250 million).  Strategic Report
                                                                   Associates            Joint ventures
            2020                                                           Individually       Individually
            US$M                                           Antamina  Cerrejón  immaterial  (1)  Samarco  (2)  immaterial   Total
            Current assets                                    974      712               49  (3)
            Non-current assets                               4,743    2,462            3,601
            Current liabilities                              (239)     (170)           (7,961)  (4)
            Non-current liabilities                          (1,173)  (854)            (5,447)
            Net assets/(liabilities) – 100%                 4,305     2,150            (9,758)
            Net assets/(liabilities) – Group share           1,453     717             (4,879)
            Adjustments to net assets related to accounting policy adjustments   −  59  256  (5)                    Governance at BHP
            Investment in Samarco                               –        –              405  (6)
            Impairment of the carrying value of the investment in Samarco    −   −      (930)  (7)
            Additional share of Samarco losses                  −        −             3,341  (8)
            Unrecognised losses                                 −        −             1,807  (9)
            Carrying amount of investments accounted for using
            the equity method                                1,453     776      356        −         −     2,585
            Revenue – 100%                                  2,464     1,091              26
            Profit/(loss) from Continuing operations – 100%   629      (182)           (3,617)  (10)
            Share of operating profit/(loss) of equity accounted investments   212  (68)  (1,918)  (11)
            Impairment of the carrying value of the investment in Samarco   –  –         (95)  (7)                  Remuneration Report
            Additional share of Samarco losses                  −        −               93
            Unrecognised losses                                 −        −              1,412  (9)
            (Loss)/profit from equity accounted investments, related
            impairments and expenses                          212      (68)     (148)   (508)        −      (512)
            Comprehensive income – 100%                       629      (182)           (3,617)
            Share of comprehensive income/(loss) – Group share in equity
            accounted investments                             212      (68)     (148)   (508)        −      (512)
            Dividends received from equity accounted investments   105   9       12        −         −      126     Directors’ Report


                                                                  Associates             Joint ventures
            2019                                                            Individually       Individually
            US$M                                           Antamina  Cerrejón  immaterial  (1)  Samarco  (2)  immaterial   Total
            Current assets                                   1,065     845               290  (3)
            Non-current assets                               4,495    2,664             6,103
            Current liabilities                               (498)    (344)           (6,704)  (4)
            Non-current liabilities                          (1,076)   (801)           (5,830)                      5
            Net assets/(liabilities) – 100%                  3,986    2,364             (6,141)
            Net assets/(liabilities) – Group share           1,345     788             (3,071)
            Adjustments to net assets related to accounting policy adjustments   −  65   366  (5)
            Investment in Samarco                               −        −               310  (6)
            Impairment of the carrying value of the investment in Samarco    −   −      (835)  (7)                  Financial Statements
            Additional share of Samarco losses                  −        −              2,835  (8)
            Unrecognised losses                                 −        −               395  (9)
            Carrying amount of investments accounted for using
            the equity method                                1,345     853       371       −         −     2,569
            Revenue – 100%                                   3,203    2,094               24
            Profit/(loss) from Continuing operations – 100%   1,168    309             (2,166)  (10)
            Share of operating profit/(loss) of equity accounted investments   394  103  (1,075)  (11)
            Impairment of the carrying value of the investment in Samarco    −   −       (96)  (7)                  Additional information
            Additional share of Samarco losses                  −        −               108
            Unrecognised losses                                 −        −               118  (9)
            (Loss)/profit from equity accounted investments, related
            impairments and expenses                          394      103       (98)   (945)        −     (546)
            Comprehensive income/(loss) – 100%               1,168     309             (2,166)
            Share of comprehensive income/(loss) – Group share in equity
            accounted investments                             394      103       (98)   (945)        −     (546)
            Dividends received from equity accounted investments   361  134      15        −         −      510     Shareholder information


                                                                                               BHP Annual Report 2020  223