
Page 226 - Annual Report 2020
P. 226
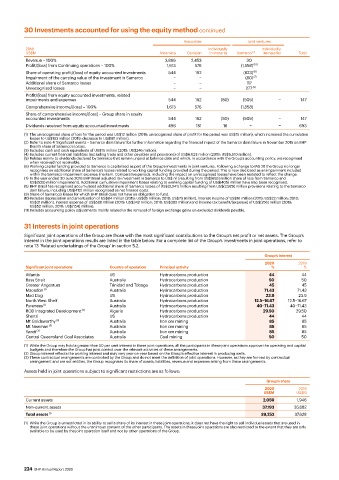
30 Investments accounted for using the equity method continued
                                                                  Associates            Joint ventures
          2018                                                            Individually       Individually
          US$M                                           Antamina  Cerrejón  immaterial  Samarco  (2)  immaterial   Total
          Revenue – 100%                                   3,866    2,453               30
          Profit/(loss) from Continuing operations – 100%   1,613    576              (1,558)  (10)
          Share of operating profit/(loss) of equity accounted investments   544  192  (823)  (11)
          Impairment of the carrying value of the investment in Samarco    −   −       (80)  (7)
          Additional share of Samarco losses                   −        −               117
          Unrecognised losses                                  −        −              277  (9)
          Profit/(loss) from equity accounted investments, related
          impairments and expenses                          544       192      (80)   (509)         −      147
          Comprehensive income/(loss) – 100%                1,613    576              (1,558)
          Share of comprehensive income/(loss) – Group share in equity
          accounted investments                             544       192      (80)   (509)         −      147
          Dividends received from equity accounted investments   496  181      16        −          −     693
          (1)  The unrecognised share of loss for the period was US$12 million (2019: unrecognised share of profit for the period was US$15 million), which increased the cumulative
           losses to US$193 million (2019: decrease to US$181 million).
          (2) Refer to note 4 ‘Significant events – Samarco dam failure’ for further information regarding the financial impact of the Samarco dam failure in November 2015 on BHP
           Brasil’s share of Samarco’s losses.
          (3) Includes cash and cash equivalents of US$15 million (2019: US$246 million).
          (4) Includes current financial liabilities (excluding trade and other payables and provisions) of US$6,023 million (2019: US$5,510 million).
          (5) Relates mainly to dividends declared by Samarco that remain unpaid at balance date and which, in accordance with the Group’s accounting policy, are recognised
           when received not receivable.
          (6) Working capital funding provided to Samarco is capitalised as part of the Group’s investments in joint ventures. Following a change to IAS 28 the Group no longer
           recognises an additional share of Samarco’s losses related to working capital funding provided during the period. This is now disclosed as an impairment included
           within the Samarco impairment expense line item. Comparative periods, including the impact on unrecognised losses have been restated to reflect the change.
          (7) In the year ended 30 June 2016 BHP Brasil adjusted its investment in Samarco to US$ nil (resulting from US$(655) million share of loss from Samarco and
           US$(525) million impairment). Additional cumulative impairment losses relating to working capital funding of US$(405) million have also been recognised.
          (8) BHP Brasil has recognised accumulated additional share of Samarco losses of US$(3,341) million resulting from US$(2,929) million provisions relating to the Samarco
           dam failure, including US$(412) million recognised as net finance costs.
          (9) Share of Samarco’s losses for which BHP Brasil does not have an obligation to fund.
          (10) Includes depreciation and amortisation of US$84 million (2019: US$85 million; 2018: US$73 million), interest income of US$16 million (2019: US$22 million; 2018:
           US$31 million), interest expense of US$588 million (2019: US$342 million; 2018: US$385 million) and income tax benefit/(expense) of US$(256) million (2019:
           US$52 million; 2018: US$(154) million).
          (11) Includes accounting policy adjustments mainly related to the removal of foreign exchange gains on excluded dividends payable.
          31 Interests in joint operations
          Significant joint operations of the Group are those with the most significant contributions to the Group’s net profit or net assets. The Group’s
          interest in the joint operations results are listed in the table below. For a complete list of the Group’s investments in joint operations, refer to
          note 13 ‘Related undertakings of the Group’ in section 5.2.
                                                                                              Group’s interest
                                                                                              2020        2019
          Significant joint operations   Country of operation  Principal activity               %           %
          Atlantis                      US               Hydrocarbons production               44          44
          Bass Strait                   Australia        Hydrocarbons production               50          50
          Greater Angostura             Trinidad and Tobago  Hydrocarbons production            45         45
          Macedon  (1)                  Australia        Hydrocarbons production              71.43      71.43
          Mad Dog                       US               Hydrocarbons production              23.9        23.9
          North West Shelf              Australia        Hydrocarbons production          12.5–16.67  12.5–16.67
          Pyrenees  (1)                 Australia        Hydrocarbons production           40–71.43    40–71.43
          ROD Integrated Development  (2)  Algeria       Hydrocarbons production             29.50       29.50
          Shenzi                        US               Hydrocarbons production               44          44
          Mt Goldsworthy  (3)           Australia        Iron ore mining                        85         85
          Mt Newman  (3)                Australia        Iron ore mining                        85         85
          Yandi  (3)                    Australia        Iron ore mining                        85         85
          Central Queensland Coal Associates  Australia   Coal mining                          50          50
          (1)  While the Group may hold a greater than 50 per cent interest in these joint operations, all the participants in these joint operations approve the operating and capital
           budgets and therefore the Group has joint control over the relevant activities of these arrangements.
          (2) Group interest reflects the working interest and may vary year-on-year based on the Group’s effective interest in producing wells.
          (3) These contractual arrangements are controlled by the Group and do not meet the definition of joint operations. However, as they are formed by contractual
           arrangement and are not entities, the Group recognises its share of assets, liabilities, revenue and expenses arising from these arrangements.
          Assets held in joint operations subject to significant restrictions are as follows:
                                                                                               Group’s share
                                                                                              2020        2019
                                                                                              US$M       US$M
          Current assets                                                                     2,059       1,946
          Non-current assets                                                                 37,193     35,682
          Total assets  (1)                                                                  39,252     37,628
          (1)  While the Group is unrestricted in its ability to sell a share of its interest in these joint operations, it does not have the right to sell individual assets that are used in
           these joint operations without the unanimous consent of the other participants. The assets in these joint operations are also restricted to the extent that they are only
           available to be used by the joint operation itself and not by other operations of the Group.


          224  BHP Annual Report 2020