
Page 206 - Annual Report 2020
P. 206
Financial management
19 Net debt
The Group seeks to maintain a strong balance sheet and deploys its capital with reference to the Capital Allocation Framework.
The Group monitors capital using the net debt balance and the gearing ratio, being the ratio of net debt to net debt plus net assets.
With effect from 1 July 2019, the net debt definition includes the fair value of derivative financial instruments used to hedge cash and
borrowings. Management believes this amendment is useful because it reflects the Group’s risk management strategy of reducing
the volatility of net debt caused by fluctuations in foreign exchange and interest rates.
Net debt-related derivative financial instruments are a subset of the other financial assets and liabilities presented in the Consolidated Balance
Sheet. Prior period comparatives have been restated to reflect the change in net debt calculation.
As a result of the adoption of IFRS 16/AASB 16 ‘Leases’ (IFRS 16) from 1 July 2019, the current period ‘Total Interest bearing liabilities’ includes
a US$2,793 million increase in gross debt during the year. The Group elected to apply the modified retrospective transition approach to IFRS
16, with no restatement of comparative periods. Refer to note 20 ‘Leases’ for information on lease liabilities.
Vessel lease contracts that are priced with reference to a freight index, which did not meet the definition of a lease under IAS 17/AASB 117
‘Leases’ (IAS 17), now meet the definition of a lease under IFRS 16. These contracts are required to be remeasured at each reporting date
to the prevailing freight index. While these liabilities are included in the Group interest bearing liabilities, they are excluded from the net debt
calculation as they do not align with how the Group assesses net debt for decision making in relation to the Capital Allocation Framework. In
addition, the freight index has historically been volatile which creates significant short-term fluctuation in these liabilities. As of 1 January 2020,
the Group excludes these liabilities from its net debt calculation.
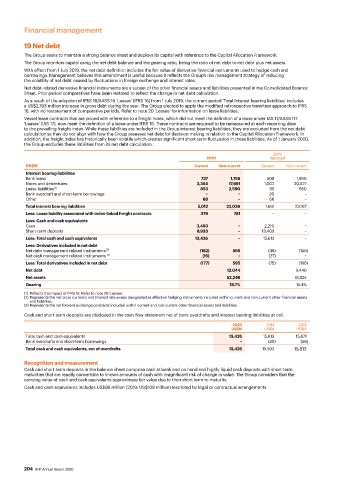
2019
2020 Restated
US$M Current Non-current Current Non-current
Interest bearing liabilities
Bank loans 737 1,755 508 1,990
Notes and debentures 3,354 17,691 1,002 20,527
Lease liabilities (1) 853 2,590 65 650
Bank overdraft and short-term borrowings − − 20 −
Other 68 − 66 −
Total interest bearing liabilities 5,012 22,036 1,661 23,167
Less: Lease liability associated with index-linked freight contracts 379 781 − −
Less: Cash and cash equivalents
Cash 3,493 − 2,210 −
Short-term deposits 9,933 − 13,403 −
Less: Total cash and cash equivalents 13,426 − 15,613 −
Less: Derivatives included in net debt
Net debt management related instruments (2) (162) 595 (48) (156)
Net cash management related instruments (3) (15) − (27) −
Less: Total derivatives included in net debt (177) 595 (75) (156)
Net debt 12,044 9,446
Net assets 52,246 51,824
Gearing 18.7% 15.4%
(1) Reflects the impact of IFRS 16. Refer to note 20 ‘Leases’.
(2) Represents the net cross currency and interest rate swaps designated as effective hedging instruments included within current and non-current other financial assets
and liabilities.
(3) Represents the net forward exchange contracts included within current and non-current other financial assets and liabilities.
Cash and short-term deposits are disclosed in the cash flow statement net of bank overdrafts and interest bearing liabilities at call.
2020 2019 2018
US$M US$M US$M
Total cash and cash equivalents 13,426 15,613 15,871
Bank overdrafts and short-term borrowings − (20) (58)
Total cash and cash equivalents, net of overdrafts 13,426 15,593 15,813
Recognition and measurement
Cash and short-term deposits in the balance sheet comprise cash at bank and on hand and highly liquid cash deposits with short-term
maturities that are readily convertible to known amounts of cash with insignificant risk of change in value. The Group considers that the
carrying value of cash and cash equivalents approximate fair value due to their short term to maturity.
Cash and cash equivalents includes US$96 million (2019: US$108 million) restricted by legal or contractual arrangements.
204 BHP Annual Report 2020