
Page 210 - Annual Report 2020
P. 210
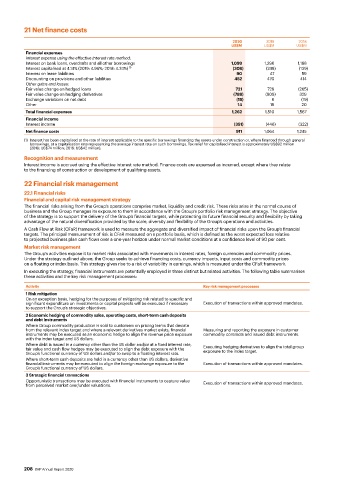
21 Net finance costs

                                                                                   2020        2019       2018
                                                                                  US$M        US$M       US$M
          Financial expenses
          Interest expense using the effective interest rate method:
          Interest on bank loans, overdrafts and all other borrowings             1,099       1,296       1,168
          Interest capitalised at 4.14% (2019: 4.96%; 2018: 4.24%)  (1)            (308)      (248)       (139)
          Interest on lease liabilities                                             90          47         59
          Discounting on provisions and other liabilities                          452         470        414
          Other gains and losses:
          Fair value change on hedged loans                                         721        729        (265)
          Fair value change on hedging derivatives                                 (788)      (809)       329
          Exchange variations on net debt                                           (18)        6          (19)
          Other                                                                     14          19         20
          Total financial expenses                                                1,262       1,510      1,567
          Financial income
          Interest income                                                          (351)      (446)       (322)
          Net finance costs                                                         911       1,064      1,245
          (1)  Interest has been capitalised at the rate of interest applicable to the specific borrowings financing the assets under construction or, where financed through general
           borrowings, at a capitalisation rate representing the average interest rate on such borrowings. Tax relief for capitalised interest is approximately US$92 million
           (2019: US$74 million; 2018: US$42 million).
          Recognition and measurement
          Interest income is accrued using the effective interest rate method. Finance costs are expensed as incurred, except where they relate
          to the financing of construction or development of qualifying assets.

          22 Financial risk management

          22.1 Financial risks
          Financial and capital risk management strategy
          The financial risks arising from the Group’s operations comprise market, liquidity and credit risk. These risks arise in the normal course of
          business and the Group manages its exposure to them in accordance with the Group’s portfolio risk management strategy. The objective
          of the strategy is to support the delivery of the Group’s financial targets, while protecting its future financial security and flexibility by taking
          advantage of the natural diversification provided by the scale, diversity and flexibility of the Group’s operations and activities.
          A Cash Flow at Risk (CFaR) framework is used to measure the aggregate and diversified impact of financial risks upon the Group’s financial
          targets. The principal measurement of risk is CFaR measured on a portfolio basis, which is defined as the worst expected loss relative
          to projected business plan cash flows over a one-year horizon under normal market conditions at a confidence level of 90 per cent.
          Market risk management
          The Group’s activities expose it to market risks associated with movements in interest rates, foreign currencies and commodity prices.
          Under the strategy outlined above, the Group seeks to achieve financing costs, currency impacts, input costs and commodity prices
          on a floating or index basis. This strategy gives rise to a risk of variability in earnings, which is measured under the CFaR framework.
          In executing the strategy, financial instruments are potentially employed in three distinct but related activities. The following table summarises
          these activities and the key risk management processes:
          Activity                                                      Key risk management processes
          1 Risk mitigation
          On an exception basis, hedging for the purposes of mitigating risk related to specific and
          significant expenditure on investments or capital projects will be executed if necessary    Execution of transactions within approved mandates.
          to support the Group’s strategic objectives.
          2 Economic hedging of commodity sales, operating costs, short-term cash deposits
          and debt instruments
          Where Group commodity production is sold to customers on pricing terms that deviate
          from the relevant index target and where a relevant derivatives market exists, financial   Measuring and reporting the exposure in customer
          instruments may be executed as an economic hedge to align the revenue price exposure    commodity contracts and issued debt instruments.
          with the index target and US dollars.
          Where debt is issued in a currency other than the US dollar and/or at a fixed interest rate,
          fair value and cash flow hedges may be executed to align the debt exposure with the    Executing hedging derivatives to align the total group
                                                                        exposure to the index target.
          Group’s functional currency of US dollars and/or to swap to a floating interest rate.
          Where short-term cash deposits are held in a currency other than US dollars, derivative
          financial instruments may be executed to align the foreign exchange exposure to the    Execution of transactions within approved mandates.
          Group’s functional currency of US dollars.
          3 Strategic financial transactions
          Opportunistic transactions may be executed with financial instruments to capture value    Execution of transactions within approved mandates.
          from perceived market over/under valuations.


          208  BHP Annual Report 2020