
Page 213 - Annual Report 2020
P. 213
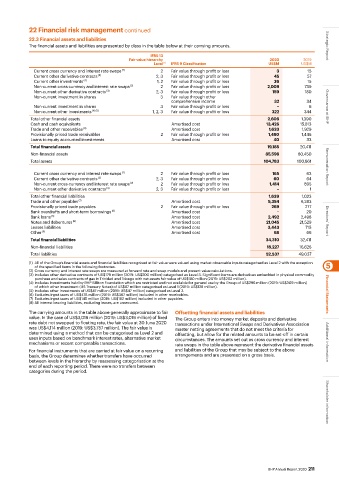
22 Financial risk management continued
           22.3 Financial assets and liabilities
           The financial assets and liabilities are presented by class in the table below at their carrying amounts.  Strategic Report

                                                      IFRS 13
                                              Fair value hierarchy                              2020        2019
                                                       Level  (1)  IFRS 9 Classification       US$M        US$M
                                             (2)
             Current cross currency and interest rate swaps    2  Fair value through profit or loss  3       15
             Current other derivative contracts  (3)    2, 3  Fair value through profit or loss  45          57
             Current other investments  (4)             1, 2  Fair value through profit or loss  36          15
             Non-current cross currency and interest rate swaps  (2)  2  Fair value through profit or loss  2,009  739
             Non-current other derivative contracts  (3)  2, 3  Fair value through profit or loss  159      180
             Non-current investment in shares            3   Fair value through other
                                                             comprehensive income                32          34
             Non-current investment in shares            3   Fair value through profit or loss     −          6     Governance at BHP
             Non-current other investments  (4) (5)    1, 2, 3  Fair value through profit or loss  322      344
            Total other financial assets                                                       2,606       1,390
            Cash and cash equivalents                        Amortised cost                    13,426     15,613
            Trade and other receivables  (6)                 Amortised cost                    1,633       1,929
            Provisionally priced trade receivables       2   Fair value through profit or loss  1,480      1,446
            Loans to equity accounted investments            Amortised cost                      40          33
            Total financial assets                                                             19,185     20,411
            Non-financial assets                                                              85,598      80,450
            Total assets                                                                      104,783    100,861    Remuneration Report
             Current cross currency and interest rate swaps  (2)  2  Fair value through profit or loss  165  63
             Current other derivative contracts  (3)    2, 3  Fair value through profit or loss  60          64
             Non-current cross currency and interest rate swaps  (2)  2  Fair value through profit or loss  1,414  895
             Non-current other derivative contracts  (3)  2, 3  Fair value through profit or loss   −         1
            Total other financial liabilities                                                  1,639       1,023
            Trade and other payables  (7)                    Amortised cost                    5,354       6,283
            Provisionally priced trade payables          2   Fair value through profit or loss  269         277
            Bank overdrafts and short-term borrowings  (8)   Amortised cost                        −         20
            Bank loans  (8)                                  Amortised cost                    2,492       2,498
            Notes and debentures  (8)                        Amortised cost                    21,045     21,529    Directors’ Report
            Leases liabilities                               Amortised cost                    3,443        715
            Other  (8)                                       Amortised cost                      68          66
            Total financial liabilities                                                       34,310      32,411
            Non-financial liabilities                                                          18,227     16,626
            Total liabilities                                                                 52,537      49,037
           (1)  All of the Group’s financial assets and financial liabilities recognised at fair value were valued using market observable inputs categorised as Level 2 with the exception
             of the specified items in the following footnotes.                                                     5
           (2) Cross currency and interest rate swaps are measured at forward rate and swap models and present value calculations.
           (3) Includes other derivative contracts of US$179 million (2019: US$200 million) categorised as Level 3. Significant items are derivatives embedded in physical commodity
             purchase and sales contracts of gas in Trinidad and Tobago with net assets fair value of US$180 million (2019: US$202 million).
           (4) Includes investments held by BHP Billiton Foundation which are restricted and not available for general use by the Group of US$296 million (2019: US$309 million)
             of which other investment (US Treasury Notes) of US$87 million categorised as Level 1 (2019: US$128 million).
           (5) Includes other investments of US$47 million (2019: US$47 million) categorised as Level 3.
           (6) Excludes input taxes of US$478 million (2019: US$367 million) included in other receivables.         Financial Statements
           (7) Excludes input taxes of US$145 million (2019: US$162 million) included in other payables.
           (8) All interest bearing liabilities, excluding leases, are unsecured.
           The carrying amounts in the table above generally approximate to fair   Offsetting financial assets and liabilities
           value. In the case of US$3,019 million (2019: US$3,019 million) of fixed   The Group enters into money market deposits and derivative
           rate debt not swapped to floating rate, the fair value at 30 June 2020   transactions under International Swaps and Derivatives Association
           was US$4,114 million (2019: US$3,757 million). The fair value is   master netting agreements that do not meet the criteria for
           determined using a method that can be categorised as Level 2 and   offsetting, but allow for the related amounts to be set-off in certain
           uses inputs based on benchmark interest rates, alternative market   circumstances. The amounts set out as cross currency and interest
           mechanisms or recent comparable transactions.       rate swaps in the table above represent the derivative financial assets   Additional information
           For financial instruments that are carried at fair value on a recurring   and liabilities of the Group that may be subject to the above
           basis, the Group determines whether transfers have occurred   arrangements and are presented on a gross basis.
           between levels in the hierarchy by reassessing categorisation at the
           end of each reporting period. There were no transfers between
           categories during the period.                                                                            Shareholder information


                                                                                               BHP Annual Report 2020  211