
Page 207 - Annual Report 2020
P. 207
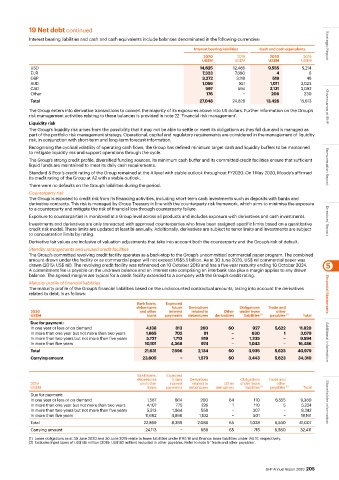
19 Net debt continued
           Interest bearing liabilities and cash and cash equivalents include balances denominated in the following currencies:
                                                                     Interest bearing liabilities  Cash and cash equivalents  Strategic Report
                                                                        2020        2019        2020        2019
                                                                        US$M        US$M       US$M        US$M
            USD                                                        14,625      12,485      9,555       9,214
            EUR                                                         7,323       7,680         4           6
            GBP                                                         3,272       3,118        519         48
            AUD                                                         1,055        951        1,011      3,023
            CAD                                                          597         594        2,131      3,092
            Other                                                        176           −        206         230
            Total                                                      27,048      24,828      13,426     15,613

           The Group enters into derivative transactions to convert the majority of its exposures above into US dollars. Further information on the Group’s   Governance at BHP
           risk management activities relating to these balances is provided in note 22 ‘Financial risk management’.
           Liquidity risk
           The Group’s liquidity risk arises from the possibility that it may not be able to settle or meet its obligations as they fall due and is managed as
           part of the portfolio risk management strategy. Operational, capital and regulatory requirements are considered in the management of liquidity
           risk, in conjunction with short-term and long-term forecast information.
           Recognising the cyclical volatility of operating cash flows, the Group has defined minimum target cash and liquidity buffers to be maintained
           to mitigate liquidity risk and support operations through the cycle.
           The Group’s strong credit profile, diversified funding sources, its minimum cash buffer and its committed credit facilities ensure that sufficient
           liquid funds are maintained to meet its daily cash requirements.                                         Remuneration Report
           Standard & Poor’s credit rating of the Group remained at the A level with stable outlook throughout FY2020. On 1 May 2020, Moody’s affirmed
           its credit rating of the Group at A2 with a stable outlook.
           There were no defaults on the Group’s liabilities during the period.
           Counterparty risk
           The Group is exposed to credit risk from its financing activities, including short-term cash investments such as deposits with banks and
           derivative contracts. This risk is managed by Group Treasury in line with the counterparty risk framework, which aims to minimise the exposure
           to a counterparty and mitigate the risk of financial loss through counterparty failure.
           Exposure to counterparties is monitored at a Group level across all products and includes exposure with derivatives and cash investments.
           Investments and derivatives are only transacted with approved counterparties who have been assigned specific limits based on a quantitative   Directors’ Report
           credit risk model. These limits are updated at least bi-annually. Additionally, derivatives are subject to tenor limits and investments are subject
           to concentration limits by rating.
           Derivative fair values are inclusive of valuation adjustments that take into account both the counterparty and the Group’s risk of default.
           Standby arrangements and unused credit facilities
           The Group’s committed revolving credit facility operates as a back-stop to the Group’s uncommitted commercial paper program. The combined
           amount drawn under the facility or as commercial paper will not exceed US$5.5 billion. As at 30 June 2020, US$ nil commercial paper was
           drawn (2019: US$ nil). The revolving credit facility was refinanced on 10 October 2019 and has a five-year maturity ending 10 October 2024.    5
           A commitment fee is payable on the undrawn balance and an interest rate comprising an interbank rate plus a margin applies to any drawn
           balance. The agreed margins are typical for a credit facility extended to a company with the Group’s credit rating.
           Maturity profile of financial liabilities
           The maturity profile of the Group’s financial liabilities based on the undiscounted contractual amounts, taking into account the derivatives
           related to debt, is as follows:                                                                          Financial Statements
                                                 Bank loans,   Expected
                                                 debentures   future   Derivatives   Obligations   Trade and
            2020                                  and other   interest   related to   Other   under lease  other
            US$M                                     loans  payments  debentures  derivatives  liabilities  (1)   payables    Total
                                                                                                      (2)
            Due for payment:
            In one year or less or on demand        4,138      813     260       60       927     5,622   11,820
            In more than one year but not more than two years  1,665  702  81      −     630         1     3,079
            In more than two years but not more than five years  5,727  1,713  819   −   1,335       −    9,594
            In more than five years                 10,101   4,368      974        −     1,043       −    16,486    Additional information
            Total                                   21,631   7,596     2,134     60     3,935     5,623   40,979
            Carrying amount                        23,605        −     1,579     60     3,443     5,623   34,310


                                                 Bank loans,   Expected
                                                 debentures   future   Derivatives   Obligations   Trade and
            2019                                  and other   interest   related to   Other   under lease   other
            US$M                                     loans  payments  debentures  derivatives  liabilities  (1)   payables    Total
                                                                                                      (2)
            Due for payment:
            In one year or less or on demand         1,587    864      200       64       110     6,555    9,380
            In more than one year but not more than two years  4,107  775  226     1      110       5      5,224    Shareholder information
            In more than two years but not more than five years  5,513  1,864  558   −    307        −     8,242
            In more than five years                 11,662   4,896     1,102       −      501        −     18,161
            Total                                   22,869   8,399    2,086      65      1,028   6,560    41,007
            Carrying amount                         24,113       −      958      65       715    6,560    32,411
           (1)  Lease obligations as at 30 June 2020 and 30 June 2019 relate to lease liabilities under IFRS 16 and finance lease liabilities under IAS 17, respectively.
           (2)  Excludes input taxes of US$145 million (2019: US$162 million) included in other payables. Refer to note 9 ‘Trade and other payables’.


                                                                                              BHP Annual Report 2020  205