Page 182 - Annual Report 2020
P. 182

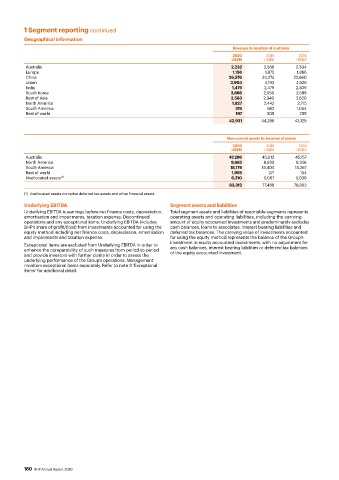
1 Segment reporting continued
          Geographical information
                                                                                   Revenue by location of customer
                                                                                   2020        2019       2018
                                                                                  US$M        US$M       US$M
          Australia                                                               2,232       2,568      2,304
          Europe                                                                   1,156      1,875      1,886
          China                                                                  26,576      24,274     22,660
          Japan                                                                   3,904       4,193      4,628
          India                                                                    1,475      2,479      2,439
          South Korea                                                             2,666       2,550      2,588
          Rest of Asia                                                            2,583       2,940      2,620
          North America                                                            1,827      2,442       2,715
          South America                                                             315        662       1,054
          Rest of world                                                             197        305        235
                                                                                 42,931      44,288     43,129


                                                                                 Non-current assets by location of assets
                                                                                   2020        2019       2018
                                                                                  US$M        US$M       US$M
          Australia                                                              47,286      45,013      45,157
          North America                                                           9,682       8,633      8,246
          South America                                                           18,179     18,404      18,267
          Rest of world                                                           1,955        371        154
          Unallocated assets  (1)                                                 6,210       5,067      5,039
                                                                                  83,312     77,488     76,863
          (1)  Unallocated assets comprise deferred tax assets and other financial assets.
          Underlying EBITDA                                  Segment assets and liabilities
          Underlying EBITDA is earnings before net finance costs, depreciation,   Total segment assets and liabilities of reportable segments represents
          amortisation and impairments, taxation expense, Discontinued   operating assets and operating liabilities, including the carrying
          operations and any exceptional items. Underlying EBITDA includes   amount of equity accounted investments and predominantly excludes
          BHP’s share of profit/(loss) from investments accounted for using the   cash balances, loans to associates, interest bearing liabilities and
          equity method including net finance costs, depreciation, amortisation   deferred tax balances. The carrying value of investments accounted
          and impairments and taxation expense.              for using the equity method represents the balance of the Group’s
          Exceptional items are excluded from Underlying EBITDA in order to   investment in equity accounted investments, with no adjustment for
                                                             any cash balances, interest bearing liabilities or deferred tax balances
          enhance the comparability of such measures from period-to-period   of the equity accounted investment.
          and provide investors with further clarity in order to assess the
          underlying performance of the Group’s operations. Management
          monitors exceptional items separately. Refer to note 3 ‘Exceptional
          items’ for additional detail.


          180  BHP Annual Report 2020
   177   178   179   180   181   182   183   184   185   186   187