
Page 183 - Annual Report 2020
P. 183
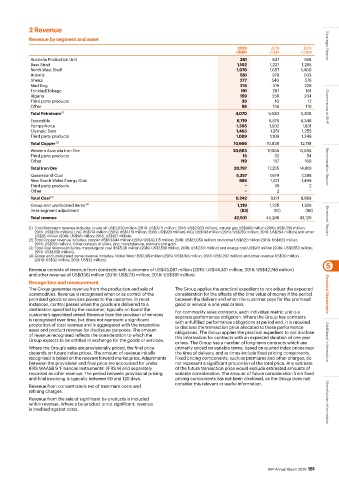
2 Revenue

           Revenue by segment and asset
                                                                                    2020        2019        2018    Strategic Report
                                                                                    US$M       US$M        US$M
            Australia Production Unit                                                361         507        568
            Bass Strait                                                             1,102       1,237      1,285
            North West Shelf                                                        1,076       1,657      1,400
            Atlantis                                                                 561         979        833
            Shenzi                                                                   277        540         576
            Mad Dog                                                                  216         319        229
            Trinidad/Tobago                                                           191        287        161
            Algeria                                                                  159         258        234
            Third party products                                                      39          10         12
            Other                                                                     88         136        110     Governance at BHP
            Total Petroleum  (1)                                                    4,070      5,930       5,408
            Escondida                                                               6,719      6,876       8,346
            Pampa Norte                                                             1,395       1,502      1,831
            Olympic Dam                                                             1,463       1,351      1,255
            Third party products                                                    1,089       1,109      1,349
            Total Copper  (2)                                                      10,666      10,838      12,781
            Western Australia Iron Ore                                             20,663      17,066     14,596
            Third party products                                                      15         32          54
            Other                                                                     119        157        160
            Total Iron Ore                                                         20,797      17,255     14,810    Remuneration Report
            Queensland Coal                                                         5,357       7,679      7,388
            New South Wales Energy Coal                                              885        1,421      1,499
            Third party products                                                        −         19          2
            Other                                                                       −         2           −
            Total Coal  (3)                                                         6,242       9,121      8,889
            Group and unallocated items  (4)                                        1,219       1,225      1,329
            Inter-segment adjustment                                                 (63)        (81)       (88)
            Total revenue                                                          42,931     44,288      43,129    Directors’ Report
           (1)  Total Petroleum revenue includes: crude oil US$2,033 million (2019: US$3,171 million; 2018: US$2,933 million), natural gas US$980 million (2019: US$1,259 million;
             2018: US$1,124 million), LNG US$774 million (2019: US$1,179 million; 2018: US$920 million), NGL US$198 million (2019: US$263 million; 2018: US$294 million) and other
             US$85 million (2019: US$58 million; 2018: US$137 million).
           (2) Total Copper revenue includes: copper US$10,044 million (2019: US$10,215 million; 2018: US$12,059 million) and other US$622 million (2019: US$623 million;
             2018: US$722 million). Other consists of silver, zinc, molybdenum, uranium and gold.
           (3) Total Coal revenue includes: metallurgical coal US$5,311 million (2019: US$7,568 million; 2018: US$7,331 million) and energy coal US$931 million (2019: US$1,553 million;
             2018: US$1,558 million).
           (4) Group and unallocated items revenue includes: Nickel West US$1,189 million (2019: US$1,193 million; 2018: US$1,297 million) and other revenue US$30 million
             (2019: US$32 million; 2018: US$32 million).
                                                                                                                    5
           Revenue consists of revenue from contracts with customers of US$43,087 million (2019: US$44,361 million; 2018: US$42,748 million)
           and other revenue of US$(156) million (2019: US$(73) million; 2018: US$381 million).
           Recognition and measurement
           The Group generates revenue from the production and sale of   The Group applies the practical expedient to not adjust the expected
           commodities. Revenue is recognised when or as control of the   consideration for the effects of the time value of money if the period   Financial Statements
           promised goods or services passes to the customer. In most   between the delivery and when the customer pays for the promised
           instances, control passes when the goods are delivered to a   good or service is one year or less.
           destination specified by the customer, typically on board the   For commodity sales contracts, each individual metric unit is a
           customer’s appointed vessel. Revenue from the provision of services    separate performance obligation. Where the Group has contracts
           is recognised over time, but does not represent a significant   with unfulfilled performance obligations at period end, it is required
           proportion of total revenue and is aggregated with the respective   to disclose the transaction price allocated to these performance
           asset and product revenue for disclosure purposes. The amount    obligations. The Group applies the practical expedient to not disclose
           of revenue recognised reflects the consideration to which the    this information for contracts with an expected duration of one year
           Group expects to be entitled in exchange for the goods or services.   or less. The Group has a number of long-term contracts which are   Additional information
           Where the Group’s sales are provisionally priced, the final price   primarily priced on variable terms, based on quoted index prices near
           depends on future index prices. The amount of revenue initially   the time of delivery, and at times include fixed pricing components.
           recognised is based on the relevant forward market price. Adjustments   Fixed pricing components, such as premiums and other charges, do
           between the provisional and final price are accounted for under    not represent a significant proportion of the total price. Any estimate
           IFRS 9/AASB 9 ‘Financial Instruments’ (IFRS 9) and separately   of the future transaction price would exclude estimated amounts of
           recorded as other revenue. The period between provisional pricing   variable consideration. The amount of future consideration from fixed
           and final invoicing is typically between 60 and 120 days.  pricing components has not been disclosed, as the Group does not
           Revenue from concentrate is net of treatment costs and    consider this relevant or useful information.
           refining charges.
           Revenue from the sale of significant by-products is included
           within revenue. Where a by-product is not significant, revenue                                           Shareholder information
           is credited against costs.


                                                                                               BHP Annual Report 2020  181