Page 181 - Annual Report 2020
P. 181

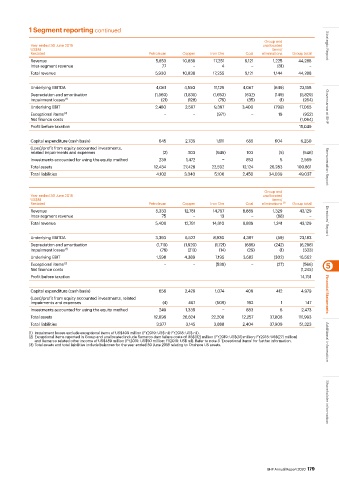
1 Segment reporting continued
                                                                                              Group and
            Year ended 30 June 2019                                                          unallocated            Strategic Report
            US$M                                                                                items/
            Restated                                 Petroleum   Copper    Iron Ore    Coal  eliminations  Group total
            Revenue                                     5,853    10,838     17,251     9,121     1,225    44,288
            Inter-segment revenue                         77         −         4          −       (81)        −
            Total revenue                               5,930    10,838     17,255     9,121     1,144    44,288

            Underlying EBITDA                           4,061     4,550     11,129    4,067      (649)    23,158
            Depreciation and amortisation              (1,560)    (1,835)   (1,653)    (632)     (149)    (5,829)
            Impairment losses  (1)                        (21)     (128)      (79)      (35)       (1)     (264)
            Underlying EBIT                             2,480     2,587     9,397     3,400      (799)    17,065    Governance at BHP
            Exceptional items  (2)                         −         −       (971)        −        19      (952)
            Net finance costs                                                                             (1,064)
            Profit before taxation                                                                        15,049

            Capital expenditure (cash basis)             645      2,735      1,611     655        604      6,250
            (Loss)/profit from equity accounted investments,
            related impairments and expenses              (2)      303       (945)      103        (5)     (546)
            Investments accounted for using the equity method  239  1,472       −      853         5       2,569
            Total assets                               12,434    27,428    22,592     12,124    26,283   100,861    Remuneration Report
            Total liabilities                           4,102     3,340     5,106     2,450    34,039     49,037

                                                                                              Group and
            Year ended 30 June 2018                                                          unallocated
            US$M                                                                                items/
            Restated                                 Petroleum   Copper    Iron Ore    Coal  eliminations  (3)  Group total
            Revenue                                     5,333     12,781    14,797    8,889      1,329    43,129
            Inter-segment revenue                         75         −        13          −       (88)        −
            Total revenue                               5,408     12,781    14,810    8,889      1,241    43,129    Directors’ Report

            Underlying EBITDA                           3,393     6,522     8,930     4,397       (59)    23,183
            Depreciation and amortisation               (1,719)   (1,920)   (1,721)    (686)     (242)    (6,288)
            Impairment losses  (1)                       (76)      (213)      (14)      (29)       (1)     (333)
            Underlying EBIT                             1,598     4,389      7,195    3,682      (302)    16,562
            Exceptional items  (2)                         −         −       (539)        −       (27)     (566)    5
            Net finance costs                                                                              (1,245)
            Profit before taxation                                                                         14,751

            Capital expenditure (cash basis)             656      2,428      1,074     409        412      4,979
            (Loss)/profit from equity accounted investments, related                                                Financial Statements
            impairments and expenses                      (4)      467       (509)      192         1       147
            Investments accounted for using the equity method  249  1,335       −      883         6       2,473
            Total assets                               12,896    26,824    22,208     12,257    37,808    111,993
            Total liabilities                           3,977     3,145     3,888     2,404     37,909    51,323
           (1)  Impairment losses exclude exceptional items of US$409 million (FY2019: US$ nil; FY2018: US$ nil).
           (2) Exceptional items reported in Group and unallocated include Samarco dam failure costs of US$(32) million (FY2019: US$(31) million; FY2018: US$(27) million)
             and Samarco related other income of US$489 million (FY2019: US$50 million; FY2018: US$ nil). Refer to note 3 ‘Exceptional items’ for further information.   Additional information
           (3) Total assets and total liabilities include balances for the year ended 30 June 2018 relating to Onshore US assets.  Shareholder information


                                                                                               BHP Annual Report 2020  179
   176   177   178   179   180   181   182   183   184   185   186