
Page 180 - Annual Report 2020
P. 180
5.1.6 Notes to the Financial Statements
Performance
1 Segment reporting
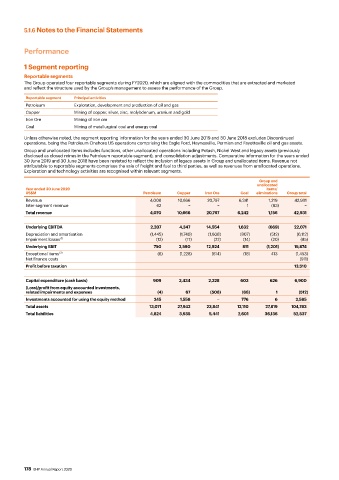
Reportable segments
The Group operated four reportable segments during FY2020, which are aligned with the commodities that are extracted and marketed
and reflect the structure used by the Group’s management to assess the performance of the Group.
Reportable segment Principal activities
Petroleum Exploration, development and production of oil and gas
Copper Mining of copper, silver, zinc, molybdenum, uranium and gold
Iron Ore Mining of iron ore
Coal Mining of metallurgical coal and energy coal
Unless otherwise noted, the segment reporting information for the years ended 30 June 2019 and 30 June 2018 excludes Discontinued
operations, being the Petroleum Onshore US operations comprising the Eagle Ford, Haynesville, Permian and Fayetteville oil and gas assets.
Group and unallocated items includes functions, other unallocated operations including Potash, Nickel West and legacy assets (previously
disclosed as closed mines in the Petroleum reportable segment), and consolidation adjustments. Comparative information for the years ended
30 June 2019 and 30 June 2018 have been restated to reflect the inclusion of legacy assets in Group and unallocated items. Revenue not
attributable to reportable segments comprises the sale of freight and fuel to third parties, as well as revenues from unallocated operations.
Exploration and technology activities are recognised within relevant segments.
Group and
unallocated
Year ended 30 June 2020 items/
US$M Petroleum Copper Iron Ore Coal eliminations Group total
Revenue 4,008 10,666 20,797 6,241 1,219 42,931
Inter-segment revenue 62 − − 1 (63) −
Total revenue 4,070 10,666 20,797 6,242 1,156 42,931
Underlying EBITDA 2,207 4,347 14,554 1,632 (669) 22,071
Depreciation and amortisation (1,445) (1,740) (1,608) (807) (512) (6,112)
Impairment losses (1) (12) (17) (22) (14) (20) (85)
Underlying EBIT 750 2,590 12,924 811 (1,201) 15,874
Exceptional items (2) (6) (1,228) (614) (18) 413 (1,453)
Net finance costs (911)
Profit before taxation 13,510
Capital expenditure (cash basis) 909 2,434 2,328 603 626 6,900
(Loss)/profit from equity accounted investments,
related impairments and expenses (4) 67 (508) (68) 1 (512)
Investments accounted for using the equity method 245 1,558 − 776 6 2,585
Total assets 13,071 27,942 23,841 12,110 27,819 104,783
Total liabilities 4,824 3,535 5,441 2,601 36,136 52,537
178 BHP Annual Report 2020