Page 350 - Annual Report 2020
P. 350
Number of fully   % of issued
          BHP Group Plc                                                                   paid shares    capital
          1.  PLC Nominees (Proprietary) Limited                                         270,434,351     12.80
                                     (2)
          2.  State Street Nominees Limited <OM02>                                        110,668,368     5.24
          3.  National City Nominees Limited                                              108,881,961     5.16
          4.  Vidacos Nominees Limited <13559>                                            101,929,550     4.83
          5.  Chase Nominees Limited <USRESLD>                                            84,850,483      4.02
          6.  The Bank of New York (Nominees) Limited                                     75,501,860      3.57
          7.  State Street Nominees Limited <OM04>                                        62,978,858      2.98
          8.  Nortrust Nominees Limited                                                   40,386,501      1.91
          9.  Hanover Nominees Limited <UBS03>                                            40,004,656      1.89
          10. Government Employees Pension Fund – Public Investment Corporation           36,212,548       1.71
          11.  Chase Nominees Limited <BBHLEND>                                           36,059,172       1.71
          12. State Street Nominees Limited <OD64>                                        30,605,959      1.45
          13. State Street Nominees Limited <OD43>                                        28,024,620      1.33
          14. Hanover Nominees Limited <JPM17>                                            27,463,879      1.30
          15. Vidacos Nominees Limited <CLRLUX2>                                          26,208,676      1.24
          16. Chase Nominees Limited                                                      24,085,532      1.14
          17.  Industrial Development Corporation of South Africa                         23,537,693       1.11
          18. Lynchwood Nominees Limited <2006420>                                        23,196,964      1.10
          19. HSBC Global Custody Nominee (UK) Limited <357206>                            21,474,128     1.02
          20. Nutraco Nominees Limited <781221>                                           18,768,923      0.89
                                                                                         1,191,274,682   56.40
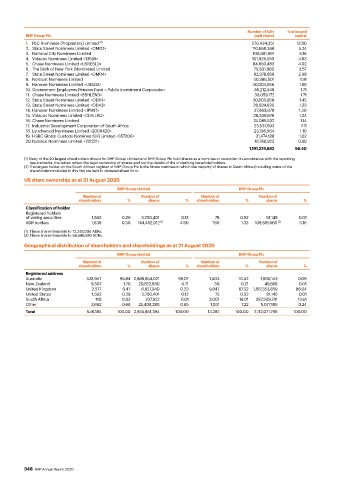
          (1) Many of the 20 largest shareholders shown for BHP Group Limited and BHP Group Plc hold shares as a nominee or custodian. In accordance with the reporting
           requirements, the tables reflect the legal ownership of shares and not the details of the underlying beneficial holders.
          (2) The largest holder on the South African register of BHP Group Plc is the Strate nominee in which the majority of shares in South Africa (including some of the
           shareholders included in this list) are held in dematerialised form.
          US share ownership as at 21 August 2020
                                          BHP Group Limited                          BHP Group Plc
                              Number of            Number of            Number of           Number of
                             shareholders      %     shares        %  shareholders      %     shares        %
          Classification of holder
          Registered holders
          of voting securities   1,562      0.29   3,700,401     0.13        75      0.52      91,145     0.01
          ADR holders            1,638      0.30  144,492,012  (1)  4.90    190       1.33  108,881,960  (2)  5.16
          (1)  These shares translate to 72,246,006 ADRs.
          (2) These shares translate to 54,440,980 ADRs.
          Geographical distribution of shareholders and shareholdings as at 21 August 2020
                                          BHP Group Limited                          BHP Group Plc
                              Number of            Number of            Number of           Number of
                             shareholders     %      shares       %   shareholders     %      shares        %
          Registered address
          Australia            528,947     96.84 2,888,854,021  98.07      1,503     10.52  1,990,143     0.09
          New Zealand            9,307      1.70  20,822,830     0.71       30        0.21    49,669      0.01
          United Kingdom         2,577      0.47   6,827,940    0.23       9,647     67.52  1,817,353,859  86.04
          United States          1,562      0.29   3,700,401     0.13        75      0.52      91,145     0.01
          South Africa             110      0.02    237,922      0.01      2,001     14.01  287,509,791   13.61
          Other                  3,682      0.68  25,408,280    0.85       1,031      7.22   5,077,189    0.24
          Total                 546,185   100.00  2,945,851,394  100.00   14,287    100.00  2,112,071,796  100.00


          348  BHP Annual Report 2020

