Page 281 - Annual Report 2020
P. 281

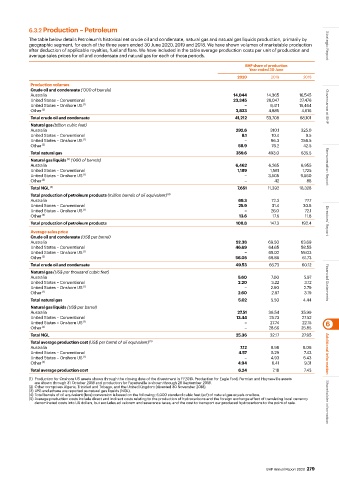
6.3.2 Production – Petroleum

           The table below details Petroleum’s historical net crude oil and condensate, natural gas and natural gas liquids production, primarily by
           geographic segment, for each of the three years ended 30 June 2020, 2019 and 2018. We have shown volumes of marketable production   Strategic Report
           after deduction of applicable royalties, fuel and flare. We have included in the table average production costs per unit of production and
           average sales prices for oil and condensate and natural gas for each of those periods.
                                                                                       BHP share of production
                                                                                         Year ended 30 June
                                                                                    2020        2019        2018
            Production volumes
            Crude oil and condensate (‘000 of barrels)
            Australia                                                              14,044      14,365     16,545
            United States – Conventional                                           23,345      28,047     27,476
            United States – Onshore US  (1)                                            –        6,411     19,464    Governance at BHP
            Other  (2)                                                              3,823      4,885       4,616
            Total crude oil and condensate                                          41,212     53,708     68,101
            Natural gas (billion cubic feet)
            Australia                                                               292.6       310.1      325.0
            United States – Conventional                                              8.1       10.4        9.5
            United States – Onshore US  (1)                                            –        96.3       258.5
            Other  (2)                                                               58.9       76.2        42.5
            Total natural gas                                                       359.6      493.0       635.5
            Natural gas liquids  (‘000 of barrels)
                         (3)
            Australia                                                               6,462      6,265       6,955    Remuneration Report
            United States – Conventional                                            1,189       1,581      1,725
            United States – Onshore US  (1)                                            –       3,505       9,560
            Other  (2)                                                                 –         42          88
            Total NGL  (3)                                                          7,651      11,392     18,328
            Total production of petroleum products (million barrels of oil equivalent)  (4)
            Australia                                                                69.3       72.3        77.7
            United States – Conventional                                             25.9       31.4       30.8
            United States – Onshore US  (1)                                            –        26.0        72.1
            Other  (2)                                                               13.6        17.6       11.8
            Total production of petroleum products                                  108.8       147.3      192.4    Directors’ Report
            Average sales price
            Crude oil and condensate (US$ per barrel)
            Australia                                                               52.38      69.50       63.69
            United States – Conventional                                            46.69      64.65       58.55
            United States – Onshore US  (1)                                            –       68.02       59.03
            Other  (2)                                                              56.05      68.86       61.73
            Total crude oil and condensate                                          49.53      66.73       60.12
            Natural gas (US$ per thousand cubic feet)
            Australia                                                                5.60       7.00        5.97
            United States – Conventional                                             2.20       3.22        3.12    Financial Statements
            United States – Onshore US  (1)                                            –        2.90        2.79
            Other  (2)                                                               2.60       2.87        3.19
            Total natural gas                                                        5.02       5.50       4.44
            Natural gas liquids (US$ per barrel)
            Australia                                                               27.51      36.54       35.99
            United States – Conventional                                            13.44       25.73      27.52
            United States – Onshore US  (1)                                            –        27.74      22.15   6
            Other  (2)                                                                 –       28.66       25.85
            Total NGL                                                               25.36       32.17      27.95
            Total average production cost (US$ per barrel of oil equivalent)  (5)
            Australia                                                                7.12       8.98       8.06
            United States – Conventional                                             4.57       5.29        7.43    Additional information
            United States – Onshore US  (1)                                            –        4.93        6.43
            Other  (2)                                                               4.94       6.41        9.31
            Total average production cost                                            6.24        7.18       7.43
           (1)  Production for Onshore US assets shown through the closing date of the divestment in FY2019. Production for Eagle Ford, Permian and Haynesville assets
             are shown through 31 October 2018 and production for Fayetteville is shown through 28 September 2018.
           (2) Other comprises Algeria, Trinidad and Tobago, and the United Kingdom (divested 30 November 2018).
           (3) LPG and ethane are reported as natural gas liquids (NGL).
           (4) Total barrels of oil equivalent (boe) conversion is based on the following: 6,000 standard cubic feet (scf) of natural gas equals one boe.
           (5) Average production costs include direct and indirect costs relating to the production of hydrocarbons and the foreign exchange effect of translating local currency
             denominated costs into US dollars, but excludes ad valorem and severance taxes, and the cost to transport our produced hydrocarbons to the point of sale.  Shareholder information


                                                                                               BHP Annual Report 2020  279
   276   277   278   279   280   281   282   283   284   285   286