
Page 279 - Annual Report 2020
P. 279
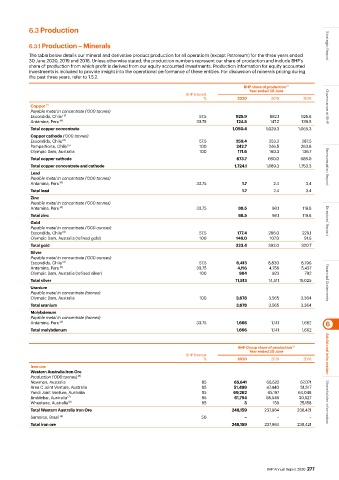
6.3 Production


           6.3.1 Production – Minerals                                                                              Strategic Report
           The table below details our mineral and derivative product production for all operations (except Petroleum) for the three years ended
           30 June 2020, 2019 and 2018. Unless otherwise stated, the production numbers represent our share of production and include BHP’s
           share of production from which profit is derived from our equity accounted investments. Production information for equity accounted
           investments is included to provide insight into the operational performance of these entities. For discussion of minerals pricing during
           the past three years, refer to 1.5.2.
                                                                                       BHP share of production
                                                                                                      (1)
                                                                                         Year ended 30 June
                                                                  BHP interest
                                                                         %          2020        2019        2018
            Copper  (2)                                                                                             Governance at BHP
            Payable metal in concentrate (‘000 tonnes)
            Escondida, Chile  ( 3)                                     57.5          925.9      882.1      925.8
            Antamina, Peru  (4)                                       33.75          124.5       147.2     139.5
            Total copper concentrate                                               1,050.4     1,029.3    1,065.3
            Copper cathode (‘000 tonnes)
            Escondida, Chile  (3)                                      57.5          259.4      253.2      287.5
            Pampa Norte, Chile  (5)                                    100           242.7      246.5      263.8
            Olympic Dam, Australia                                     100          171.6       160.3      136.7
            Total copper cathode                                                    673.7      660.0       688.0
            Total copper concentrate and cathode                                   1,724.1     1,689.3    1,753.3   Remuneration Report
            Lead
            Payable metal in concentrate (‘000 tonnes)
            Antamina, Peru  (4)                                       33.75           1.7         2.4       3.4
            Total lead                                                                 1.7        2.4       3.4
            Zinc
            Payable metal in concentrate (‘000 tonnes)
            Antamina, Peru  (4)                                       33.75          88.5        98.1      119.8
            Total zinc                                                               88.5        98.1      119.8
            Gold                                                                                                    Directors’ Report
            Payable metal in concentrate (‘000 ounces)
            Escondida, Chile  (3)                                      57.5          177.4     286.0       229.1
            Olympic Dam, Australia (refined gold)                      100          146.0       107.0       91.6
            Total gold                                                              323.4      393.0       320.7
            Silver
            Payable metal in concentrate (‘000 ounces)
            Escondida, Chile  (3)                                      57.5         6,413      8,830       8,796
            Antamina, Peru  (4)                                       33.75         4,116      4,758       5,437
            Olympic Dam, Australia (refined silver)                    100           984         923        792
            Total silver                                                            11,513     14,511     15,025    Financial Statements
            Uranium
            Payable metal in concentrate (tonnes)
            Olympic Dam, Australia                                     100          3,678      3,565       3,364
            Total uranium                                                           3,678      3,565       3,364
            Molybdenum
            Payable metal in concentrate (tonnes)
            Antamina, Peru  (4)                                       33.75         1,666       1,141      1,662   6
            Total molybdenum                                                        1,666       1,141      1,662


                                                                                     BHP Group share of production
                                                                                                         (1)
                                                                                         Year ended 30 June
                                                                  BHP interest                                      Additional information
                                                                         %          2020        2019        2018
            Iron ore
            Western Australia Iron Ore
            Production (‘000 tonnes)  (6)
            Newman, Australia                                           85         65,641      66,622     67,071
            Area C Joint Venture, Australia                             85         51,499      47,440      51,517
            Yandi Joint Venture, Australia                              85         69,262      65,197     64,048
            Jimblebar, Australia  (7)                                   85         61,754     58,546      30,627
            Wheelarra, Australia  (8)                                   85             3         159      25,158    Shareholder information
            Total Western Australia Iron Ore                                      248,159     237,964    238,421
            Samarco, Brazil  (4)                                        50             –          –           –
            Total iron ore                                                        248,159     237,964    238,421


                                                                                               BHP Annual Report 2020  277