
Page 195 - Annual Report 2020
P. 195
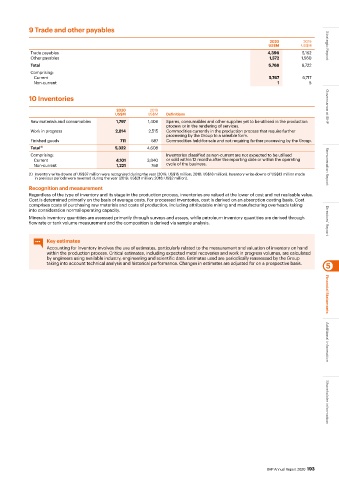
9 Trade and other payables

                                                                                                2020        2019
                                                                                               US$M        US$M     Strategic Report
            Trade payables                                                                     4,396       5,162
            Other payables                                                                      1,372      1,560
            Total                                                                              5,768       6,722
            Comprising:
             Current                                                                           5,767       6,717
             Non-current                                                                          1           5
           10 Inventories


                                          2020        2019                                                          Governance at BHP
                                         US$M        US$M  Definitions
            Raw materials and consumables  1,797     1,406  Spares, consumables and other supplies yet to be utilised in the production
                                                           process or in the rendering of services.
            Work in progress              2,814      2,515  Commodities currently in the production process that require further
                                                           processing by the Group to a saleable form.
            Finished goods                 711        687  Commodities held-for-sale and not requiring further processing by the Group.
            Total  (1)                   5,322       4,608
            Comprising:                                    Inventories classified as non-current are not expected to be utilised
             Current                      4,101      3,840  or sold within 12 months after the reporting date or within the operating
             Non-current                  1,221       768  cycle of the business.                                   Remuneration Report
           (1)  Inventory write-downs of US$37 million were recognised during the year (2019: US$16 million; 2018: US$18 million). Inventory write-downs of US$13 million made
             in previous periods were reversed during the year (2019: US$21 million; 2018: US$2 million).
           Recognition and measurement
           Regardless of the type of inventory and its stage in the production process, inventories are valued at the lower of cost and net realisable value.
           Cost is determined primarily on the basis of average costs. For processed inventories, cost is derived on an absorption costing basis. Cost
           comprises costs of purchasing raw materials and costs of production, including attributable mining and manufacturing overheads taking
           into consideration normal operating capacity.
           Minerals inventory quantities are assessed primarily through surveys and assays, while petroleum inventory quantities are derived through
           flow rate or tank volume measurement and the composition is derived via sample analysis.                 Directors’ Report


                 Key estimates
                 Accounting for inventory involves the use of estimates, particularly related to the measurement and valuation of inventory on hand
                 within the production process. Critical estimates, including expected metal recoveries and work in progress volumes, are calculated
                 by engineers using available industry, engineering and scientific data. Estimates used are periodically reassessed by the Group
                 taking into account technical analysis and historical performance. Changes in estimates are adjusted for on a prospective basis.  5


                                                                                                                    Financial Statements


                                                                                                                    Additional information


                                                                                               BHP Annual Report 2020  193  Shareholder information