
Page 194 - Annual Report 2020
P. 194
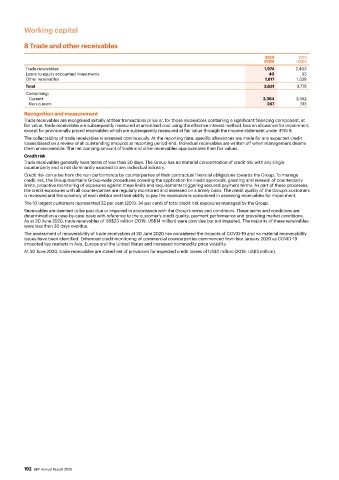
Working capital


          8 Trade and other receivables

                                                                                              2020        2019
                                                                                              US$M       US$M
          Trade receivables                                                                   1,974      2,403
          Loans to equity accounted investments                                                40          33
          Other receivables                                                                   1,617      1,339
          Total                                                                               3,631      3,775
          Comprising:
           Current                                                                           3,364       3,462
           Non-current                                                                         267        313
          Recognition and measurement
          Trade receivables are recognised initially at their transactions price or, for those receivables containing a significant financing component, at
          fair value. Trade receivables are subsequently measured at amortised cost using the effective interest method, less an allowance for impairment,
          except for provisionally priced receivables which are subsequently measured at fair value through the income statement under IFRS 9.
          The collectability of trade receivables is assessed continuously. At the reporting date, specific allowances are made for any expected credit
          losses based on a review of all outstanding amounts at reporting period-end. Individual receivables are written off when management deems
          them unrecoverable. The net carrying amount of trade and other receivables approximates their fair values.
          Credit risk
          Trade receivables generally have terms of less than 30 days. The Group has no material concentration of credit risk with any single
          counterparty and is not dominantly exposed to any individual industry.
          Credit risk can arise from the non-performance by counterparties of their contractual financial obligations towards the Group. To manage
          credit risk, the Group maintains Group-wide procedures covering the application for credit approvals, granting and renewal of counterparty
          limits, proactive monitoring of exposures against these limits and requirements triggering secured payment terms. As part of these processes,
          the credit exposures with all counterparties are regularly monitored and assessed on a timely basis. The credit quality of the Group’s customers
          is reviewed and the solvency of each debtor and their ability to pay the receivable is considered in assessing receivables for impairment.
          The 10 largest customers represented 32 per cent (2019: 34 per cent) of total credit risk exposures managed by the Group.
          Receivables are deemed to be past due or impaired in accordance with the Group’s terms and conditions. These terms and conditions are
          determined on a case-by-case basis with reference to the customer’s credit quality, payment performance and prevailing market conditions.
          As at 30 June 2020, trade receivables of US$23 million (2019: US$14 million) were past due but not impaired. The majority of these receivables
          were less than 30 days overdue.
          The assessment of recoverability of trade receivables at 30 June 2020 has considered the impacts of COVID-19 and no material recoverability
          issues have been identified. Enhanced credit monitoring of commercial counterparties commenced from late January 2020 as COVID-19
          impacted key markets in Asia, Europe and the United States and increased commodity price volatility.
          At 30 June 2020, trade receivables are stated net of provisions for expected credit losses of US$2 million (2019: US$3 million).


          192  BHP Annual Report 2020