
Page 298 - Annual Report 2020
P. 298
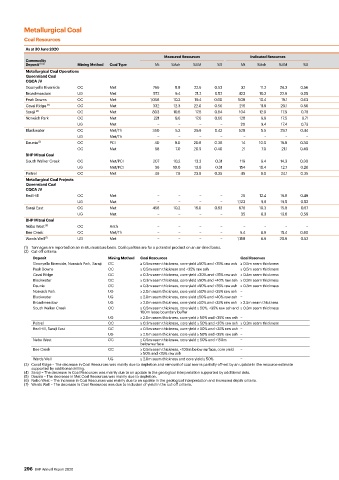
Metallurgical Coal

          Coal Resources
          As at 30 June 2020                                                                                                                                                                                      As at 30 June 2019
                                                           Measured Resources            Indicated Resources                                Inferred Resources             Total Resources           BHP           Total Resources
          Commodity                                                                                                                                                                                Interest
          Deposit  (1) (2)  Mining Method  Coal Type   Mt    %Ash    %VM     %S       Mt   %Ash    %VM     %S                           Mt   %Ash    %VM      %S      Mt    %Ash    %VM      %S       %       Mt    %Ash    %VM     %S
          Metallurgical Coal Operations
          Queensland Coal
          CQCA JV
          Goonyella Riverside   OC      Met            766    8.8    22.6   0.53      32    11.2   24.3    0.56                        40     12.6    25.1   0.54     838     9.1   22.8    0.53      50     856     9.1    22.8   0.53
          Broadmeadow       UG          Met            572     9.4   21.2   0.52     423    10.2   22.9    0.55                         15    13.4    24.5   0.59    1,010    9.8    21.9   0.53             1,018   9.8    21.9   0.53
          Peak Downs        OC          Met           1,058   10.2   19.4   0.60     508    10.4    19.1   0.63                        424     11.4   20.2   0.75    1,990   10.5    19.4   0.63      50    2,051   10.0    19.6   0.66
          Caval Ridge  (3)  OC          Met            332    12.3   22.0   0.56     216    11.9    20.1   0.56                        147     11.9   18.8   0.49     695    12.1   20.7    0.54      50     760     13.0   22.1   0.59
          Saraji  (4)       OC          Met            803    10.6    17.6  0.64     104    12.0    17.9   0.78                        40      11.7   18.6   0.83     947    10.8    17.6   0.66      50    1,023    10.8   17.7   0.66
          Norwich Park      OC          Met            221     9.6    17.6  0.66     128     9.9    17.5   0.71                        116    10.3    17.7   0.76     465     9.8    17.6   0.70      50     465     9.8    17.6   0.70
                            UG          Met             −       −      −      −       20     9.4    17.4   0.73                         22     9.9    17.1   0.65     42      9.7    17.2   0.69              42     9.7    17.2   0.69
          Blackwater        OC          Met/Th         350     5.2   29.6   0.42     528     5.5   29.7    0.44                        779     6.6    29.8   0.43    1,657   6.0     29.7   0.43      50    1,659    6.8    27.9   0.42
                            UG          Met/Th          −       −      −      −       −       −      −       −                         222     7.2    29.1   0.36     222     7.2    29.1   0.36             222     7.2    29.1   0.36
          Daunia  (5)       OC          PCI            40     9.0    20.8   0.36      14    10.0    19.9  0.30                          5.1   13.0    19.3   0.30     59     10.0   20.5    0.30      50      59    10.0    20.5   0.30
                            OC          Met            58      7.0   20.9   0.40      21     7.0    21.1  0.40                         5.5     7.0    21.1   0.40     85      7.0   20.9    0.40              92     7.0    20.9   0.40
          BHP Mitsui Coal
          South Walker Creek  OC        Met/PCI        207    10.2   13.3    0.31    119     9.4   14.3   0.30                          71    10.4    15.7   0.40     398    10.0   14.0    0.32      80     405    10.0    14.0   0.32
                            UG          Met/PCI        36     10.0   13.8    0.31    154    10.4    12.7   0.28                        108     9.5    15.2   0.35     298    10.0    13.7   0.31             298    10.0    13.8    0.31
          Poitrel           OC          Met            49      7.9   23.9   0.35      49     8.0    24.1   0.35                         59     8.0    24.1   0.36     157    8.0    24.0    0.36      80     163     8.0    24.0   0.36
          Metallurgical Coal Projects
          Queensland Coal
          CQCA JV
          Red Hill          OC          Met             −       −      −      −       25    12.4    19.8   0.49                          −      −       −      −      25     12.4    19.8   0.49      50      25     12.4   19.8   0.49
                            UG          Met             −       −      −      −     1,123    9.8    19.5   0.52                        563    10.0    20.4   0.52    1,686    9.9    19.8   0.52            1,686    9.9    19.8   0.52
          Saraji East       OC          Met            458    10.2   16.0   0.63     676    10.3    15.8   0.67                        504    10.0    15.3   0.68    1,638   10.2    15.7   0.66      50    1,638    10.2   15.7   0.66
                            UG          Met             −       −      −      −       35     8.3    13.6   0.59                         16     8.5    13.9   0.59      51     8.4    13.7   0.59              51     8.4    13.7   0.59
          BHP Mitsui Coal
          Nebo West  (6)    OC          Anth            –       –      –      –       −       −      −       −                          71    10.0     7.2   0.67      71    10.0    7.2    0.67      80      14     9.4     6.6   0.64
          Bee Creek         OC          Met/Th          –       –      –      –      9.4     8.9    15.4  0.40                          13     9.6    15.0   0.42     23      9.3    15.2   0.41      80      23     9.3    15.2    0.41
          Wards Well  (7)   UG          Met             –       –      –      –     1,158    8.9   20.9    0.52                        149     9.2   20.0    0.52    1,306    8.9   20.8    0.52      80    1,373    8.9    20.6   0.53
          (1)  Tonnages are reported on an in situ moisture basis. Coal qualities are for a potential product on an air-dried basis.
          (2)  Cut-off criteria:
             Deposit                   Mining Method  Coal Resources                 Coal Reserves
             Goonyella Riverside, Norwich Park, Saraji  OC  ≥ 0.5m seam thickness, core yield ≥50% and <35% raw ash ≥ 0.5m seam thickness
             Peak Downs                OC         ≥ 0.5m seam thickness and <35% raw ash  ≥ 0.5m seam thickness
             Caval Ridge               OC         ≥ 0.3m seam thickness, core yield ≥30% and <35% raw ash ≥ 0.4m seam thickness
             Blackwater                OC         ≥ 0.3m seam thickness, core yield ≥50% and <40% raw ash ≥ 0.3m seam thickness
             Daunia                    OC         ≥ 0.3m seam thickness, core yield ≥50% and <35% raw ash ≥ 0.3m seam thickness
             Norwich Park              UG         ≥ 2.0m seam thickness, core yield ≥50% and <35% raw ash −
             Blackwater                UG         ≥ 2.0m seam thickness, core yield ≥50% and <40% raw ash −
             Broadmeadow               UG         ≥ 2.0m seam thickness, core yield ≥50% and <35% raw ash ≥ 2.5m seam thickness
             South Walker Creek        OC         ≥ 0.5m seam thickness, core yield ≥ 50%, <35% raw ash and  ≥ 0.3m seam thickness
                                                  100m lease boundary buffer
                                       UG         ≥ 2.0m seam thickness, core yield ≥ 50% and <35% raw ash −
             Poitrel                   OC         ≥ 0.3m seam thickness, core yield ≥ 50% and <35% raw ash ≥ 0.3m seam thickness
             Red Hill, Saraji East     OC         ≥ 0.5m seam thickness, core yield ≥ 50% and <35% raw ash −
                                       UG         ≥ 2.0m seam thickness, core yield ≥ 50% and <35% raw ash −
             Nebo West                 OC         ≥ 0.5m seam thickness, core yield ≥ 50% and <150m    −
                                                  below surface
             Bee Creek                 OC         ≥ 0.5m seam thickness, <100m below surface, core yield    −
                                                  ≥ 50% and <35% raw ash
             Wards Well                UG         ≥ 2.0m seam thickness and core yield ≥ 50%   −
          (3)   Caval Ridge – The decrease in Coal Resources was mainly due to depletion and removal of coal seams partially off-set by an update in the resource estimate
            supported by additional drilling.
          (4)   Saraji – The decrease in Coal Resources was mainly due to an update in the geological interpretation supported by additional data.
          (5)   Daunia – The decrease in Met Coal Resources was mainly due to depletion.
          (6)   Nebo West – The increase in Coal Resources was mainly due to an update in the geological interpretation and increased depth criteria.
          (7)   Wards Well – The decrease in Coal Resources was due to inclusion of yield in the cut-off criteria.


          296  BHP Annual Report 2020