
Page 302 - Annual Report 2020
P. 302
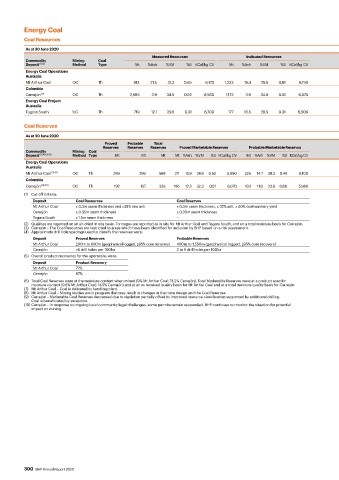
Energy Coal

          Coal Resources
          As at 30 June 2020                                                                                                                                                                                      As at 30 June 2019
                                                      Measured Resources                Indicated Resources                                 Inferred Resources             Total Resources           BHP           Total Resources
          Commodity        Mining   Coal                                                                                                                                                           Interest
          Deposit  (1) (2)  Method  Type         Mt  %Ash  %VM     %S  KCal/kg CV  Mt  %Ash  %VM    %S  KCal/kg CV                    Mt  %Ash  %VM   %S  KCal/kg CV  Mt  %Ash  %VM  %S  KCal/kg CV   %     Mt  %Ash  %VM   %S  KCal/kg CV
          Energy Coal Operations
          Australia
          Mt Arthur Coal   OC       Th          814   21.5  31.2  0.65   6,170  1,333  19.4  29.9  0.61   6,150                     1,255  20.6  29.3  0.62  6,050  3,402  20.3  30.0  0.62  6,120   100  3,423  20.4  30.0  0.62  6,120
          Colombia
          Cerrejón  (3)    OC       Th         2,989  3.9   34.9  0.52   6,560  1,173  3.9   34.8  0.51   6,570                      620   4.7  34.0  0.55  6,370  4,782  4.0  34.8  0.52  6,539    33.33  4,600  3.9  34.8  0.52  6,540
          Energy Coal Project
          Australia
          Togara South     UG       Th          719   12.1  29.6  0.31   6,700   177   13.5  28.9  0.31   6,500                     1,051  16.8  28.4  0.31  6,210  1,947  14.8  28.9  0.31  6,420   100  1,947  14.8  28.9  0.31  6,420

          Coal Reserves
          As at 30 June 2020                                                                                                                                                                              As at 30 June 2019
                                      Proved   Probable   Total
                                     Reserves  Reserves  Reserves  Proved Marketable Reserves  Probable Marketable Reserves                 Total Marketable Reserves     Reserve     BHP           Total Marketable Reserves    Reserve
          Commodity        Mining  Coal                                                                                                                                      Life   Interest                                        Life
          Deposit  (1) (4) (5) (6)  Method Type  Mt  Mt   Mt   Mt %Ash  %VM  %S KCal/kg CV  Mt %Ash  %VM  %S KCal/kg CV                Mt    %Ash   %VM     %S  KCal/kg CV  (years)    %      Mt    %Ash   %VM     %S  KCal/kg CV  (years)
          Energy Coal Operations
          Australia
          Mt Arthur Coal  (7) (8)  OC  Th  269    299    568  211  15.9  28.6  0.52  5,990  225  14.7  28.2  0.46  6,100              436     15.3  28.4   0.49   6,050      20       100     453    15.3   28.4  0.49    6,050      21
          Colombia
          Cerrejón  (9) (10)  OC  Th     192      137    329  186  12.3  32.3  0.61  6,070  133  11.0  33.0  0.60  5,980               319    11.8  32.6    0.61   6,032      14     33.33    333    11.2   32.4   0.61   6,101      15
          (1)  Cut-off criteria:
             Deposit        Coal Resources                     Coal Reserves
             Mt Arthur Coal  ≥ 0.3m seam thickness and ≤35% raw ash   ≥ 0.3m seam thickness, ≤ 32% ash, ≥ 40% coal washery yield
             Cerrejón       ≥ 0.35m seam thickness             ≥ 0.35m seam thickness
             Togara South   ≥ 1.5m seam thickness              −
          (2)   Qualities are reported on an air-dried in situ basis. Tonnages are reported as in situ for Mt Arthur Coal and Togara South, and on a total moisture basis for Cerrejón.
          (3)   Cerrejón – The Coal Resources are restricted to areas which have been identified for inclusion by BHP based on a risk assessment.
          (4)   Approximate drill hole spacings used to classify the reserves were:
             Deposit        Proved Reserves                    Probable Reserves
             Mt Arthur Coal  200m to 800m (geophysical logged, ≥95% core recovery)  400m to 1,550m (geophysical logged, ≥95% core recovery)
             Cerrejón       >6 drill holes per 100ha           2 to 6 drill holes per 100ha
          (5)   Overall product recoveries for the operations were:
             Deposit        Product Recovery
             Mt Arthur Coal  77%
             Cerrejón       97%
          (6)  Total Coal Reserves were at the moisture content when mined (9% Mt Arthur Coal; 13.2% Cerrejón). Total Marketable Reserves were at a product specific
            moisture content (9.6% Mt Arthur Coal; 14.5% Cerrejón) and at an as received quality basis for Mt Arthur Coal and at a total moisture quality basis for Cerrejón.
          (7)  Mt Arthur Coal – Coal is delivered to handling plant.
          (8)   Mt Arthur Coal – Mining studies are in progress that may result in changes in the mine design and the Coal Reserves.
          (9)  Cerrejón – Marketable Coal Reserves decreased due to depletion partially offset by improved resource classification supported by additional drilling.
            Coal is beneficiated by exception.
          (10) Cerrejón – In response to ongoing local community legal challenges, some permits remain suspended. BHP continues to monitor the situation for potential
            impact on mining.


          300  BHP Annual Report 2020