
Page 297 - Annual Report 2020
P. 297
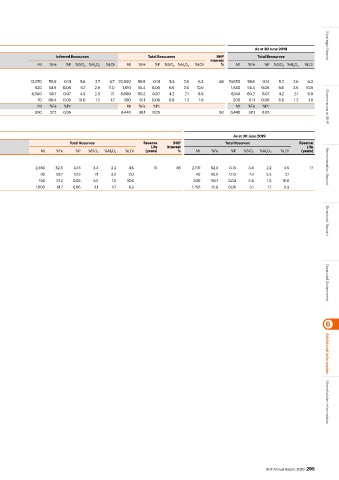
Iron Ore

 Mineral Resources
 As at 30 June 2020                                                                        As at 30 June 2019       Strategic Report
 Measured Resources  Indicated Resources  Inferred Resources  Total Resources  BHP         Total Resources
 Commodity                                                                 Interest
 Deposit  (1) (2)  Ore Type  Mt  %Fe  %P  %SiO 2  %Al 2 O 3  %LOI  Mt  %Fe  %P  %SiO 2  %Al 2 O 3  %LOI  Mt  %Fe  %P  %SiO 2 %Al 2 O 3  %LOI  Mt  %Fe  %P  %SiO 2 %Al 2 O 3  %LOI  %  Mt  %Fe  %P  %SiO 2 %Al 2 O 3  %LOI
 Iron Ore Operations
 Australia
 WAIO  (3) (4)  BKM  1,870  61.5  0.13  4.1  2.4  4.8  5,140  60.1  0.14  4.9  2.5  5.9  13,070  58.9  0.14  5.6  2.7  6.7  20,080  59.5  0.14  5.3  2.6  6.3  88  19,650  59.6  0.14  5.2  2.6  6.3
 CID  540  55.7  0.05  6.4  2.2  11.1  360  56.3  0.06  6.4  2.3  10.3  920  54.9  0.06  6.7  2.9  11.0  1,810  55.4  0.06  6.6  2.6  10.9  1,850  55.4  0.06  6.6  2.6  10.9
 MM  1,230  62.1  0.07  2.8  1.6  6.2  2,060  60.3  0.06  4.2  2.1  6.9  4,800  59.7  0.07  4.5  2.3  7.1  8,090  60.2  0.07  4.2  2.1  6.9  8,140  60.2  0.07  4.2  2.1  6.9
 NIM  10  59.0  0.08  10.1  1.2  3.9  120  61.6  0.06  8.0  1.1  1.7  70  60.4  0.05  10.0  1.2  1.7  200  61.1  0.06  8.8  1.2  1.8  200  61.1  0.06  8.8  1.2  1.8
 Brazil  Mt  %Fe  %Pc  Mt  %Fe  %Pc  Mt  %Fe  %Pc  Mt  %Fe  %Pc                     Mt  %Fe  %Pc                    Governance at BHP
 Samarco  ROM  3,340  39.0  0.05  2,150  37.2  0.05  950  37.2  0.06  6,440  38.1  0.05  50  6,440  38.1  0.05

 Ore Reserves
 As at 30 June 2020                                                                As at 30 June 2019
 Proved Reserves  Probable Reserves  Total Reserves  Reserve   BHP              Total Reserves            Reserve
 Commodity                                            Life   Interest                                        Life
 Deposit  Ore Type  Mt  %Fe  %P  %SiO 2  %Al 2 O 3  %LOI  Mt  %Fe  %P  %SiO 2  %Al 2 O 3  %LOI  Mt  %Fe  %P  %SiO 2  %Al 2 O 3  %LOI  (years)  %  Mt  %Fe  %P  %SiO 2  %Al 2 O 3  %LOI  (years)
 Iron Ore Operations
 Australia
 WAIO  (1) (3) (4) (5) (6) (7) (8) (9) (10)  BKM  910  63.1  0.12  2.9  2.1  4.3  1,570  62.2  0.13  3.5  2.2  4.8  2,480  62.5  0.13  3.3  2.2  4.6  15  88  2,710  62.3  0.13  3.4  2.2  4.6  17  Remuneration Report
 BKM Bene  10  59.8  0.13  6.9  3.5  2.1  10  59.6  0.13  7.4  3.1  2.0  30  59.7  0.13  7.1  3.3  2.0  40  59.5  0.13  7.3  3.3  2.1
 CID  120  57.0  0.05  5.7  1.6  10.7  30  57.9  0.05  5.1  1.5  10.3  150  57.2  0.05  5.5  1.5  10.6  300  56.7  0.04  6.4  1.5  10.6
 MM  560  62.4  0.06  2.7  1.5  6.0  1,240  61.4  0.06  3.4  1.8  6.5  1,800  61.7  0.06  3.1  1.7  6.3  1,760  61.8  0.06  3.1  1.7  6.3  Directors’ Report


                                                                                                                    Financial Statements


                                                                                                                   6


                                                                                                                    Additional information


                                                                                               BHP Annual Report 2020  295  Shareholder information