
Page 300 - Annual Report 2020
P. 300
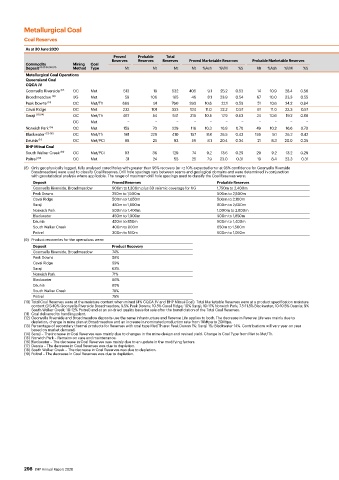
Metallurgical Coal

          Coal Reserves
          As at 30 June 2020                                                                                                                                                                               As at 30 June 2019
                                         Proved   Probable   Total
                                        Reserves  Reserves  Reserves  Proved Marketable Reserves  Probable Marketable Reserves             Total Marketable Reserves     Reserve      BHP          Total Marketable Reserves     Reserve
          Commodity        Mining   Coal                                                                                                                                    Life    Interest                                        Life
          Deposit  (2) (8) (9) (10) (11)  Method  Type  Mt  Mt  Mt  Mt  %Ash  %VM    %S    Mt  %Ash  %VM   %S                            Mt    %Ash     %VM       %S      (years)       %       Mt     %Ash     %VM       %S      (years)
          Metallurgical Coal Operations
          Queensland Coal
          CQCA JV
          Goonyella Riverside  (12)  OC  Met  513      19    532   405    9.1  25.2  0.53  14   10.9  28.4  0.56                        419      9.1     25.3    0.53        35        50       432      9.1    25.3     0.53       38
          Broadmeadow      UG    Met         59       106     165   46    8.1  23.9  0.54  67   10.0  23.3  0.55                        112      9.2     23.5    0.55                           120      9.2    23.6     0.54
                   (12)
          Peak Downs  (13)  OC   Met/Th     669        91    760    393  10.6  22.1  0.59  51   10.6  24.2  0.84                        444     10.6     22.3    0.62        27        50      443      10.6    22.5     0.62       26
          Caval Ridge      OC    Met        232       101    333    134  11.0  22.2  0.57  61   11.0  22.3  0.57                        196     11.0     22.2    0.57        27        50      203      11.0    22.3     0.58        28
          Saraji  (13) (14)  OC  Met/Th     487        54     541   315  10.5  17.9  0.63  24   10.6  19.2  0.88                        339     10.5     18.0    0.65        33        50        −        −       −        −         31
                           OC    Met          −         −      −     −     −    −     −     −     −    −     −                           −        −        −       −                            293     10.2     17.8    0.65
          Norwich Park  (15)  OC  Met       159        70    229    116  10.3  16.8  0.70  49   10.2  16.6  0.70                        165     10.3     16.7    0.70        65        50       165     10.3     16.7    0.70       65
          Blackwater  (13) (16)  OC  Met/Th  181      229    410    157   8.8  26.5  0.43  195   9.1  26.2  0.42                        352      9.0     26.3    0.42        27        50      396      8.4     26.7     0.43        24
          Daunia  (17)     OC    Met/PCI     68        25     93    59    8.1  20.4  0.34  21   8.3  20.0  0.35                         80       8.2     20.3    0.34        17        50       85       8.2    20.3     0.34        18
          BHP Mitsui Coal
          South Walker Creek  (18)  OC  Met/PCI  93    36     129   74    9.2  13.6  0.29  29   9.2  13.2  0.29                         102      9.2     13.5    0.29        16        80       108      9.2    13.5     0.30        17
          Poitrel  (19)    OC    Met         31        24     55    25    7.9  23.0  0.31  19   8.4  23.3  0.31                          44      8.1     23.1    0.31       9.6        80       48       8.1     23.1    0.31        10
          (8)   Only geophysically logged, fully analysed cored holes with greater than 95% recovery (or <± 10% expected error at 95% confidence for Goonyella Riverside
            Broadmeadow) were used to classify Coal Reserves. Drill hole spacings vary between seams and geological domains and were determined in conjunction
            with geostatistical analysis where applicable. The range of maximum drill hole spacings used to classify the Coal Reserves were:
             Deposit                    Proved Reserves                      Probable Reserves
             Goonyella Riverside, Broadmeadow  900m to 1,300m plus 3D seismic coverage for UG  1,750m to 2,400m
             Peak Downs                 250m to 1,500m                       500m to 2,500m
             Caval Ridge                500m to 1,050m                       500m to 2,100m
             Saraji                     450m to 1,800m                       800m to 2,600m
             Norwich Park               500m to 1,400m                       1,000m to 2,800m
             Blackwater                 450m to 1,000m                       900m to 1,850m
             Daunia                     450m to 850m                         900m to 1,400m
             South Walker Creek         400m to 800m                         650m to 1,500m
             Poitrel                    300m to 550m                         600m to 1,050m
          (9)  Product recoveries for the operations were:
             Deposit                    Product Recovery
             Goonyella Riverside, Broadmeadow  74%
             Peak Downs                 58%
             Caval Ridge                59%
             Saraji                     63%
             Norwich Park               71%
             Blackwater                 86%
             Daunia                     85%
             South Walker Creek         78%
             Poitrel                    79%
          (10) Total Coal Reserves were at the moisture content when mined (4% CQCA JV and BHP Mitsui Coal). Total Marketable Reserves were at a product specification moisture
            content (9.5-10% Goonyella Riverside Broadmeadow; 9.5% Peak Downs; 10.5% Caval Ridge; 10% Saraji; 10-11% Norwich Park; 7.5-11.5% Blackwater; 10-10.5% Daunia; 9%
            South Walker Creek; 10-12% Poitrel) and at an air-dried quality basis for sale after the beneficiation of the Total Coal Reserves.
          (11)  Coal delivered to handling plant.
          (12)   Goonyella Riverside and Broadmeadow deposits use the same infrastructure and Reserve Life applies to both. The decrease in Reserve Life was mainly due to
            depletion, change in mine plan at Broadmeadow and an increase in nominated production rate from 19Mtpa to 20Mtpa.
          (13) Percentage of secondary thermal products for Reserves with coal type Met/Th are: Peak Downs 1%; Saraji 1%; Blackwater 14%. Contributions will vary year on year
            based on market demand.
          (14) Saraji – The increase in Coal Reserves was mainly due to changes in the mine design and revised yield. Change in Coal Type from Met to Met/Th.
          (15) Norwich Park – Remains on care and maintenance.
          (16) Blackwater – The decrease in Coal Reserves was mainly due to an update in the modifying factors.
          (17)  Daunia – The decrease in Coal Reserves was due to depletion.
          (18) South Walker Creek – The decrease in Coal Reserves was due to depletion.
          (19) Poitrel – The decrease in Coal Reserves was due to depletion.


          298  BHP Annual Report 2020