
Page 288 - Annual Report 2020
P. 288
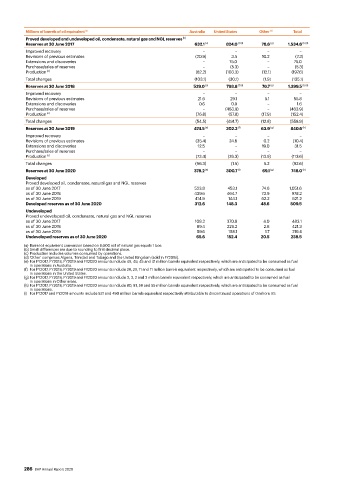
Millions of barrels of oil equivalent  (a)                Australia  United States  Other  (d)  Total
          Proved developed and undeveloped oil, condensate, natural gas and NGL reserves  (b)
          Reserves at 30 June 2017                                    632.1  (e)   824.0  (f) (i)     78.6     1,534.6  (h) (i)
                                                                                                 (g)
          Improved recovery                                             –           –          –          –
          Revisions of previous estimates                             (20.9)       3.5        10.2       (7.3)
          Extensions and discoveries                                    –         75.0         –         75.0
          Purchase/sales of reserves                                    –          (5.3)       –         (5.3)
          Production  (c)                                             (82.2)     (103.3)      (12.1)    (197.6)
          Total changes                                               (103.1)     (30.1)      (1.9)     (135.1)
                                                                                                 (g)
          Reserves at 30 June 2018                                    529.0  (e)   793.8  (f) (i)     76.7     1,399.5  (h) (i)
          Improved recovery                                             –           –          –          –
          Revisions of previous estimates                              21.6        29.1        5.1       55.8
          Extensions and discoveries                                    0.6        0.9         –          1.6
          Purchase/sales of reserves                                    –        (463.9)       –       (463.9)
          Production  (c)                                             (76.8)      (57.8)     (17.9)     (152.4)
          Total changes                                               (54.5)     (491.7)     (12.8)     (558.9)
          Reserves at 30 June 2019                                    474.5      302.2       63.9  (g)    840.6
                                                                                     (f)
                                                                          (e)
                                                                                                            (h)
          Improved recovery                                             –           –          –          –
          Revisions of previous estimates                             (35.4)      24.8        0.2        (10.4)
          Extensions and discoveries                                   12.5         –         19.0       31.5
          Purchase/sales of reserves                                    –           –          –          –
          Production  (c)                                             (73.4)      (26.3)     (13.9)     (113.6)
          Total changes                                               (96.3)       (1.5)      5.2       (92.6)
                                                                                                            (h)
          Reserves at 30 June 2020                                    378.2      300.7  (f)   69.1  (g)   748.0
                                                                          (e)
          Developed
          Proved developed oil, condensate, natural gas and NGL reserves
          as of 30 June 2017                                          523.8       453.1       74.6     1,051.6
          as of 30 June 2018                                          439.6      464.7        73.9      978.2
          as of 30 June 2019                                          414.9       144.1      62.2       621.2
          Developed reserves as of 30 June 2020                       312.6      148.3       48.6       509.5
          Undeveloped
          Proved undeveloped oil, condensate, natural gas and NGL reserves
          as of 30 June 2017                                          108.2      370.8        4.0       483.1
          as of 30 June 2018                                           89.4      329.2        2.8       421.3
          as of 30 June 2019                                           59.6       158.1        1.7      219.4
          Undeveloped reserves as of 30 June 2020                      65.6      152.4       20.5       238.5
          (a)  Barrel oil equivalent conversion based on 6,000 scf of natural gas equals 1 boe.
          (b)  Small differences are due to rounding to first decimal place.
          (c)  Production includes volumes consumed by operations.
          (d)  ‘Other’ comprises Algeria, Trinidad and Tobago and the United Kingdom (sold in FY2019).
          (e)  For FY2017, FY2018, FY2019 and FY2020 amounts include 49, 49, 45 and 41 million barrels equivalent respectively, which are anticipated to be consumed as fuel
           in operations in Australia.
          (f)  For FY2017, FY2018, FY2019 and FY2020 amounts include 28, 29, 11 and 11 million barrels equivalent respectively, which are anticipated to be consumed as fuel
           in operations in the United States.
          (g)  For FY2017, FY2018, FY2019 and FY2020 amounts include 3, 3, 2 and 3 million barrels equivalent respectively, which are anticipated to be consumed as fuel
           in operations in Other areas.
          (h)  For FY2017, FY2018, FY2019 and FY2020 amounts include 80, 81, 58 and 55 million barrels equivalent respectively, which are anticipated to be consumed as fuel
           in operations.
          (i)   For FY2017 and FY2018 amounts include 531 and 490 million barrels equivalent respectively attributable to discontinued operations of Onshore US.


          286  BHP Annual Report 2020