
Page 287 - Annual Report 2020
P. 287
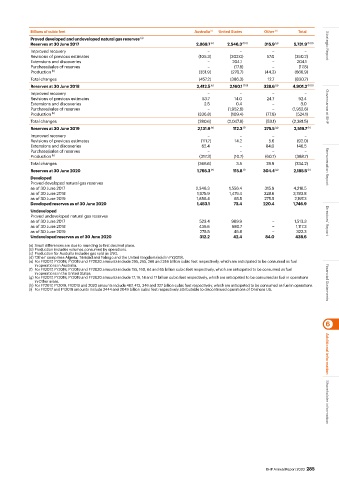
Billions of cubic feet                                   Australia  (c)  United States  Other  (d)  Total
            Proved developed and undeveloped natural gas reserves  (a)
            Reserves at 30 June 2017                                   2,869.7  (e)    2,546.3  (f) (i)    315.9     5,731.9  (h) (i)  Strategic Report
                                                                                                  (g)
            Improved recovery                                             –          –           –          –
            Revisions of previous estimates                            (105.3)    (302.0)      57.0      (350.2)
            Extensions and discoveries                                    –        204.1         –        204.1
            Purchase/sales of reserves                                    –         (17.8)       –         (17.8)
            Production  (b)                                            (351.9)     (270.7)     (44.3)    (666.9)
            Total changes                                               (457.2)   (386.3)       12.7     (830.7)
            Reserves at 30 June 2018                                   2,412.5  (e)    2,160.1  (f) (i)   328.6  (g)    4,901.2  (h) (i)
            Improved recovery                                             –          –           –          –
            Revisions of previous estimates                              53.7       14.0       24.7       92.4
            Extensions and discoveries                                   2.5         0.4         –         3.0
            Purchase/sales of reserves                                    –       (1,952.8)      –      (1,952.8)   Governance at BHP
            Production  (b)                                            (336.8)     (109.4)     (77.8)     (524.1)
            Total changes                                              (280.6)    (2,047.8)    (53.1)   (2,381.5)
            Reserves at 30 June 2019                                   2,131.9  (e)    112.3  (f)    275.5  (g)    2,519.7  (h)
            Improved recovery                                             –          –           –          –
            Revisions of previous estimates                             (111.7)     14.2        5.6       (92.0)
            Extensions and discoveries                                  62.4         –         84.0       146.5
            Purchase/sales of reserves                                    –          –           –          –
            Production  (b)                                             (317.3)     (10.7)     (60.7)    (388.7)
            Total changes                                              (366.6)       3.5       28.9      (334.2)
            Reserves at 30 June 2020                                   1,765.3  (e)   115.8  (f)    304.4  (g)   2,185.5  (h)   Remuneration Report
            Developed
            Proved developed natural gas reserves
            as of 30 June 2017                                        2,346.3     1,556.4      315.9     4,218.5
            as of 30 June 2018                                         1,975.9    1,479.4     328.6      3,783.8
            as of 30 June 2019                                         1,856.4      65.5       275.5     2,197.3
            Developed reserves as of 30 June 2020                      1,453.1      73.4      220.4      1,746.9
            Undeveloped
            Proved undeveloped natural gas reserves
            as of 30 June 2017                                          523.4      989.9         –       1,513.3    Directors’ Report
            as of 30 June 2018                                          436.6      680.7         –        1,117.3
            as of 30 June 2019                                          275.5       46.8         –        322.3
            Undeveloped reserves as of 30 June 2020                     312.2       42.4       84.0      438.6
           (a) Small differences are due to rounding to first decimal place.
           (b) Production includes volumes consumed by operations.
           (c) Production for Australia includes gas sold as LNG.
           (d) ‘Other’ comprises Algeria, Trinidad and Tobago and the United Kingdom (sold in FY2019).
           (e) For FY2017, FY2018, FY2019 and FY2020 amounts include 295, 295, 268 and 246 billion cubic feet respectively, which are anticipated to be consumed as fuel
             in operations in Australia.
           (f)  For FY2017, FY2018, FY2019 and FY2020 amounts include 155, 160, 64 and 65 billion cubic feet respectively, which are anticipated to be consumed as fuel
             in operations in the United States.
           (g) For FY2017, FY2018, FY2019 and FY2020 amounts include 17, 16, 14 and 17 billion cubic feet respectively, which are anticipated to be consumed as fuel in operations
             in Other areas.
           (h) For FY2017, FY2018, FY2019 and 2020 amounts include 467, 472, 346 and 327 billion cubic feet respectively, which are anticipated to be consumed as fuel in operations.  Financial Statements
           (i)  For FY2017 and FY2018 amounts include 2444 and 2049 billion cubic feet respectively attributable to discontinued operations of Onshore US.


                                                                                                                   6


                                                                                                                    Additional information


                                                                                               BHP Annual Report 2020  285  Shareholder information