
Page 20 - Annual Report 2020
P. 20
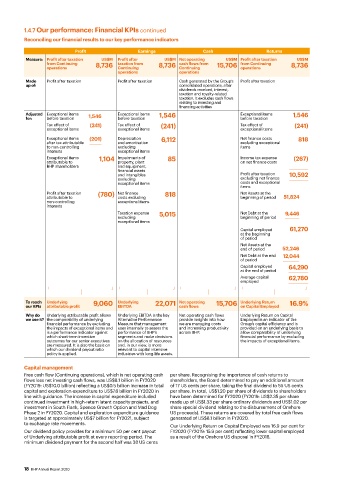
1.4.7 Our performance: Financial KPIs continued
          Reconciling our financial results to our key performance indicators
                           Profit                 Earnings              Cash                   Returns
          Measure: Profit after taxation   US$M  Profit after   US$M Net operating    US$M Profit after taxation   US$M
                 from Continuing   8,736  taxation from   8,736  cash flows from   15,706  from Continuing   8,736
                 operations               Continuing            Continuing           operations
                                          operations            operations
          Made    Profit after taxation   Profit after taxation  Cash generated by the Group’s   Profit after taxation
          up of:                                                consolidated operations, after
                                                                dividends received, interest,
                                                                taxation and royalty-related
                                                                taxation. It excludes cash flows
                                                                relating to investing and
                                                                financing activities
          Adjusted  Exceptional items    1,546  Exceptional items   1,546            Exceptional items   1,546
          for:   before taxation          before taxation                            before taxation
                 Tax effect of    (241)   Tax effect of   (241)                      Tax effect of      (241)
                 exceptional items        exceptional items                          exceptional items
                 Exceptional items   (201)  Depreciation    6,112                    Net finance costs    818
                 after tax attributable   and amortisation                           excluding exceptional
                 to non-controlling       excluding                                  items
                 interests                exceptional items
                 Exceptional items   1,104  Impairments of   85                      Income tax expense   (267)
                 attributable to          property, plant                            on net finance costs
                 BHP shareholders         and equipment,
                                          financial assets
                                          and intangibles                            Profit after taxation   10,592
                                          excluding                                  excluding net finance
                                          exceptional items                          costs and exceptional
                                                                                     items
                 Profit after taxation   (780)  Net finance    818                   Net Assets at the
                 attributable to          costs excluding                            beginning of period  51,824
                 non-controlling          exceptional items
                 interests
                                          Taxation expense   5,015                   Net Debt at the   9,446
                                          excluding                                  beginning of period
                                          exceptional items
                                                                                     Capital employed    61,270
                                                                                     at the beginning
                                                                                     of period
                                                                                     Net Assets at the
                                                                                     end of period  52,246
                                                                                     Net Debt at the end    12,044
                                                                                     of period
                                                                                     Capital employed    64,290
                                                                                     at the end of period
                                                                                     Average capital   62,780
                                                                                     employed


          To reach   Underlying    9,060  Underlying    22,071  Net operating    15,706  Underlying Return    16.9%
          our KPIs  attributable profit   EBITDA                cash flows           on Capital Employed
          Why do    Underlying attributable profit allows   Underlying EBITDA is the key   Net operating cash flows   Underlying Return on Capital
          we use it? the comparability of underlying   Alternative Performance   provide insights into how    Employed is an indicator of the
                 financial performance by excluding   Measure that management   we are managing costs    Group’s capital efficiency and is
                 the impacts of exceptional items and  uses internally to assess the   and increasing productivity   provided on an underlying basis to
                 is a performance indicator against   performance of BHP’s   across BHP.  allow comparability of underlying
                 which short-term incentive   segments and make decisions            financial performance by excluding
                 outcomes for our senior executives   on the allocation of resources   the impacts of exceptional items.
                 are measured. It is also the basis on   and, in our view, is more
                 which our dividend payout ratio   relevant to capital intensive
                 policy is applied.       industries with long-life assets.

          Capital management
          Free cash flow (Continuing operations), which is net operating cash   per share. Recognising the importance of cash returns to
          flows less net investing cash flows, was US$8.1 billion in FY2020   shareholders, the Board determined to pay an additional amount
          (FY2019: US$10.0 billion) reflecting a US$0.5 billion increase in total   of 17 US cents per share, taking the final dividend to 55 US cents
          capital and exploration expenditure to US$7.6 billion in FY2020 in   per share. In total, US$1.20 per share of dividends to shareholders
          line with guidance. The increase in capital expenditure included   have been determined for FY2020 (FY2019: US$2.35 per share
          continued investment in high-return latent capacity projects, and   made up of US$1.33 per share ordinary dividends and US$1.02 per
          investment in South Flank, Spence Growth Option and Mad Dog   share special dividend relating to the disbursement of Onshore
          Phase 2 in FY2020. Capital and exploration expenditure guidance    US proceeds). These returns are covered by total free cash flows
          is targeted at approximately US$7 billion for FY2021, subject    generated of US$8.1 billion in FY2020.
          to exchange rate movements.                        Our Underlying Return on Capital Employed was 16.9 per cent for
          Our dividend policy provides for a minimum 50 per cent payout    FY2020 (FY2019: 15.9 per cent) reflecting lower capital employed
          of Underlying attributable profit at every reporting period. The   as a result of the Onshore US disposal in FY2018.
          minimum dividend payment for the second half was 38 US cents


          18  BHP Annual Report 2020