
Page 19 - Annual Report 2020
P. 19
1.4.7 Our performance: Financial KPIs 1
Key performance indicators
Our key performance indicators (KPIs) enable us to measure our Following BHP’s sale of the Onshore US assets, the contribution
sustainable development and financial performance. These KPIs are of these assets to the Group’s results is presented in this Annual
used to assess performance of our people throughout the Group. Report as Discontinued operations. To enable more meaningful Strategic Report
comparisons with prior year disclosures and in some cases to
For information on our approach to performance and reward, comply with applicable statutory requirements, the data in section
refer to section 3.
1.4.7 has been presented to include Onshore US, except for
For information on our overall approach to executive remuneration, Underlying EBITDA. Footnotes to tables and infographics indicate
including remuneration policies and remuneration outcomes, refer whether data presented in section 1.4.7 is inclusive or exclusive
to section 3. of Onshore US.
For more information on the accounting treatment,
refer to section 5. Governance at BHP
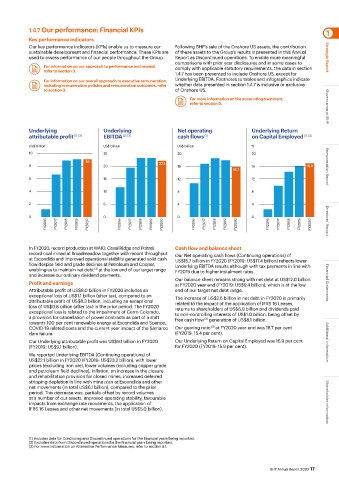
Underlying Underlying Net operating Underlying Return
attributable profit (1) (3) EBITDA (2) (3) cash flows (1) on Capital Employed (1) (3)
US$ billion US$ billion US$ billion %
10 25 20 20
9.1
8 20 22.1 16 16 16.9 Remuneration Report
15.7
6 15 12 12
4 10 8 8
2 5 4 4
0 0 0 0
FY2016 FY2017 FY2018 FY2019 FY2020 FY2016 FY2017 FY2018 FY2019 FY2020 FY2016 FY2017 FY2018 FY2019 FY2020 FY2016 FY2017 FY2018 FY2019 FY2020 Directors’ Report
In FY2020, record production at WAIO, Caval Ridge and Poitrel; Cash flow and balance sheet
record coal mined at Broadmeadow together with record throughput Our Net operating cash flows (Continuing operations) of
at Escondida and improved operational stability generated solid cash US$15.7 billion in FY2020 (FY2019: US$17.4 billion) reflects lower
flow despite field and grade declines at Petroleum and Copper, Underlying EBITDA results although with tax payments in line with
(3)
enabling us to maintain net debt at the low end of our target range FY2019 due to higher instalment rates.
and increase our ordinary dividend payments.
Profit and earnings Our balance sheet remains strong with net debt at US$12.0 billion Financial Statements
at FY2020 year end (FY2019: US$9.4 billion), which is at the low
Attributable profit of US$8.0 billion in FY2020 includes an end of our target net debt range.
exceptional loss of US$1.1 billion (after tax), compared to an The increase of US$2.6 billion in net debt in FY2020 is primarily
attributable profit of US$8.3 billion, including an exceptional related to the impact of the application of IFRS 16 Leases,
loss of US$0.8 billion (after tax) in the prior period. The FY2020 returns to shareholders of US$6.9 billion and dividends paid
exceptional loss is related to the impairment of Cerro Colorado, to non-controlling interests of US$1.0 billion, being offset by
a provision for cancellation of power contracts as part of a shift free cash flow generation of US$8.1 billion.
(3)
towards 100 per cent renewable energy at Escondida and Spence,
(3)
COVID-19 related costs and the current year impact of the Samarco Our gearing ratio at FY2020 year end was 18.7 per cent
dam failure. (FY2019: 15.4 per cent).
Our Underlying attributable profit was US$9.1 billion in FY2020 Our Underlying Return on Capital Employed was 16.9 per cent Additional information
(FY2019: US$9.1 billion). for FY2020 (FY2019: 15.9 per cent).
We reported Underlying EBITDA (Continuing operations) of
US$22.1 billion in FY2020 (FY2019: US$23.2 billion), with lower
prices (excluding iron ore), lower volumes (including copper grade
and petroleum field declines), inflation, an increase in the closure
and rehabilitation provision for closed mines, increased deferred
stripping depletion in line with mine plan at Escondida and other
net movements (in total US$6.1 billion), compared to the prior
period. This decrease was, partially offset by record volumes
at a number of our assets, improved operating stability, favourable
impacts from exchange rate movements, the application of Shareholder information
IFRS 16 Leases and other net movements (in total US$5.0 billion).
(1) Includes data for Continuing and Discontinued operations for the financial years being reported.
(2) Excludes data from Discontinued operations for the financial years being reported.
(3) For more information on Alternative Performance Measures, refer to section 6.1.
BHP Annual Report 2020 17