
Page 22 - Annual Report 2020
P. 22
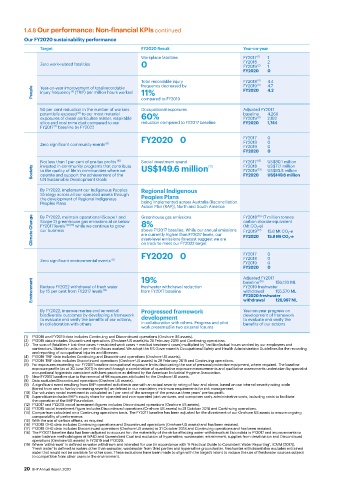
1.4.8 Our performance: Non-financial KPIs continued
          Our FY2020 sustainability performance
               Target                              FY2020 Result                      Year-on-year
                                                   Workplace fatalities               FY2017  (1)  1
               Zero work-related fatalities        0                                  FY2018  (2)  2 1
                                                                                      FY2019
                                                                                      FY2020   0
                                                   Total recordable injury            FY2018  (4)  4.4
                                                                                            (5)
                                                                                      FY2019
                                                   frequency decreased by
                                                                                               4.7
            People  Year-on-year improvement of total recordable   11%                FY2020   4.2
               injury frequency  (TRIF) per million hours worked
                           (3)
                                                   compared to FY2019
               50 per cent reduction in the number of workers   Occupational exposures    Adjusted FY2017
               potentially exposed  to our most material                              baseline  4,266
                             (6)
               exposures of diesel particulate matter, respirable  60%                FY2019  (8)  2,192
               silica and coal mine dust compared to our    reduction compared to FY2017 baseline  FY2020   1,744
               FY2017  baseline by FY2022
                     (7)
                                                   FY2020    0                        FY2017   0
               Zero significant community events  (9)                                 FY2018   0
                                                                                               0
                                                                                      FY2019
                                                                                      FY2020   0
               Not less than 1 per cent of pre-tax profits  (10)    Social investment spend  (11)  FY2017  (12)    US$80.1 million
                                                                                               US$77.1 million
               invested in community programs that contribute
                                                                                      FY2018
            Society  to the quality of life in communities where we   US$149.6 million  FY2019  (13)    US$93.5 million
               operate and support the achievement of the
                                                                                               US$149.6 million
                                                                                      FY2020
               UN Sustainable Development Goals
               By FY2022, implement our Indigenous Peoples   Regional Indigenous
               Strategy across all our operated assets through
               the development of Regional Indigenous    Peoples Plans
               Peoples Plans                       being implemented across Australia (Reconciliation
                                                   Action Plan (RAP)), North and South America  FY2018  (16)  17 million tonnes
                                                   Greenhouse gas emissions
               By FY2022, maintain operational (Scope 1 and
            Climate Change  Scope 2) greenhouse gas emissions at or below   8%        carbon dioxide equivalent
                                                                                      (Mt CO 2 -e)
                            while we continue to grow
               FY2017 levels
                         (14) (15)
               our business
                                                   above FY2017 baseline. While our annual emissions
                                                                                      FY2019
                                                                                                15.8 Mt CO 2 -e
                                                                                            (17)
                                                   are currently higher than FY2017 levels, our
                                                                                      FY2020
                                                                                               15.8 Mt CO 2 -e
                                                   asset-level emissions forecast suggest we are
                                                   on track to meet our FY2022 target
                                                   FY2020    0                        FY2017   0
               Zero significant environmental events  (9)                             FY2018   0
                                                                                               0
                                                                                      FY2019
                                                                                      FY2020   0
                                                   19%
                                                                                      Adjusted FY2017
            Environment  Reduce FY2022 withdrawal of fresh water    freshwater withdrawal reduction    baseline  (18)     156,120 ML
                                                                                      FY2019 freshwater
                                                                                                  155,570 ML
               by 15 per cent from FY2017 levels
                                                   from FY2017 baseline
                                                                                      withdrawal
                                      (19)
                                                                                      FY2020 freshwater
                                                                                                  126,997 ML
                                                                                      withdrawal
               By FY2022, improve marine and terrestrial    Progressed framework      Year-on-year progress on
               biodiversity outcomes by developing a framework                        development of framework
               to evaluate and verify the benefits of our actions,   development      to evaluate and verify the
               in collaboration with others        in collaboration with others. Progress and pilot    benefits of our actions
                                                   work presented in two external forums
          (1)  FY2018 and FY2019 data includes Continuing and Discontinued operations (Onshore US assets).
          (2)  FY2019 data includes Discontinued operations (Onshore US assets) to 28 February 2019 and Continuing operations.
          (3)  The sum of (fatalities + lost-time cases + restricted work cases + medical treatment cases) multiplied by 1 million/actual hours worked by our employees and
            contractors. Stated in units of per million hours worked. We adopt the US Government’s Occupational Safety and Health Administration Guidelines for the recording
            and reporting of occupational injuries and illnesses.
          (4)  FY2018 TRIF data includes Continuing and Discontinued operations (Onshore US assets).
          (5)  FY2019 TRIF data includes Discontinued operations (Onshore US assets) to 28 February 2019 and Continuing operations.
          (6)  For exposures exceeding our FY2017 baseline occupational exposure limits discounting the use of personal protective equipment, where required. The baseline
            exposure profile (as at 30 June 2017) is derived through a combination of quantitative exposure measurements and qualitative assessments undertaken by specialist
            occupational hygienists consistent with best practice as defined by the American Industrial Hygiene Association.
          (7)  New FY2017 baseline due to the removal of 98 exposures attributed to the Onshore US assets.
          (8)  Data excludes Discontinued operations (Onshore US assets).
          (9)  A significant event resulting from BHP operated activities is one with an actual severity rating of four and above, based on our internal severity rating scale
            (tiered from one to five by increasing severity) as defined in our mandatory minimum requirements for risk management.
          (10)  Our voluntary social investment is calculated as 1 per cent of the average of the previous three years’ pre-tax profit.
          (11)  Expenditure includes BHP’s equity share for operated and non-operated joint ventures, and comprises cash, administrative costs, including costs to facilitate
            the operation of the BHP Foundation.
          (12)  FY2017 and FY2018 social investment figures includes Discontinued operations (Onshore US assets).
          (13)  FY2019 social investment figure includes Discontinued operations (Onshore US assets) to 31 October 2018 and Continuing operations.
          (14)  Comparison calculated on a Continuing operations basis. The FY2017 baseline has been adjusted for the divestment of our Onshore US assets to ensure ongoing
            comparability of performance.
          (15)  With the use of carbon offsets, as required.
          (16)  FY2018 GHG data includes Continuing operations and Discontinued operations (Onshore US assets) and has been restated.
          (17)  FY2019 GHG data includes Discontinued operations (Onshore US assets) to 31 October 2018 and Continuing operations and has been restated.
          (18)  The FY2017 baseline data has been adjusted to account for: the materiality of the strike affecting water withdrawals at Escondida in FY2017 and improvements to
            water balance methodologies at WAIO and Queensland Coal and exclusion of hypersaline, wastewater, entrainment, supplies from desalination and Discontinued
            operations (Onshore US assets) in FY2019 and FY2020.
          (19)  Where ‘withdrawal’ is defined as water withdrawn and intended for use (in accordance with ‘A Practical Guide to Consistent Water Reporting’, ICMM (2017)).
            ‘Fresh water’ is defined as waters other than seawater, wastewater from third parties and hypersaline groundwater. Freshwater withdrawal also excludes entrained
            water that would not be available for other uses. These exclusions have been made to align with the target’s intent to reduce the use of freshwater sources subject
            to competition from other users or the environment.
          20  BHP Annual Report 2020