
Page 25 - Annual Report 2020
P. 25
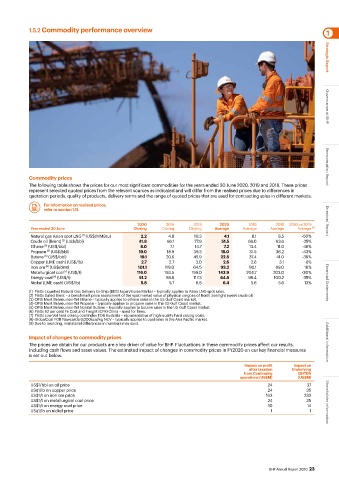
1.5.2 Commodity performance overview                                                                     1


                                                                                                                    Strategic Report


           Commodity prices                                                                                         Governance at BHP
           The following table shows the prices for our most significant commodities for the years ended 30 June 2020, 2019 and 2018. These prices
                                                                                                                    Remuneration Report
           represent selected quoted prices from the relevant sources as indicated and will differ from the realised prices due to differences in
           quotation periods, quality of products, delivery terms and the range of quoted prices that are used for contracting sales in different markets.
                For information on realised prices,
                refer to section 1.11.


                                                 2020      2019      2018     2020      2019      2018   2020 vs 2019  Directors’ Report
            Year ended 30 June                  Closing   Closing  Closing  Average   Average   Average  Average  (9)
            Natural gas Asian spot LNG  (US$/MMBtu)  2.2    4.8      10.3       4.1      8.1       8.5     -50%
                               (1)
                        (2)
            Crude oil (Brent)  (US$/bbl)          41.8      66.1     77.9      51.5     69.0      63.6     -25%
            Ethane  (US$/bbl)                     8.0        7.1     14.7       7.2      13.4     11.0     -46%
                 (3)
            Propane  (US$/bbl)                    19.0      18.9     39.3      18.0      31.5     36.2     -43%
                  (4)
                 (5)
            Butane  (US$/bbl)                     19.1     20.6      45.9      22.8      37.4     41.0     -39%
            Copper (LME cash) (US$/lb)             2.7      2.7       3.0      2.6       2.8       3.1      -8%
            Iron ore  (US$/dmt)                  101.1     118.0     64.5     93.2       80.1     69.0      16%
                  (6)
                        (7)
            Metallurgical coal  (US$/t)          116.0     193.5    199.0     143.9     204.7    203.0     -30%
            Energy coal  (US$/t)                  51.2     68.8      117.3    64.5      99.4     100.2     -35%
                    (8)
            Nickel (LME cash) (US$/lb)            5.8       5.7       6.8      6.4       5.6       5.6      13%     Financial Statements
           (1)  Platts Liquefied Natural Gas Delivery Ex-Ship (DES) Japan/Korea Marker – typically applies to Asian LNG spot sales.
           (2) Platts Dated Brent – a benchmark price assessment of the spot market value of physical cargoes of North Sea light sweet crude oil.
           (3) OPIS Mont Belvieu non-Tet Ethane – typically applies to ethane sales in the US Gulf Coast market.
           (4) OPIS Mont Belvieu non-Tet Propane – typically applies to propane sales in the US Gulf Coast market.
           (5) OPIS Mont Belvieu non-Tet Normal Butane – typically applies to butane sales in the US Gulf Coast market.
           (6) Platts 62 per cent Fe Cost and Freight (CFR) China – used for fines.
           (7) Platts Low-Vol hard coking coal Index FOB Australia – representative of high-quality hard coking coals.
           (8) GlobalCoal FOB Newcastle 6,000kcal/kg NCV – typically applies to coal sales in the Asia Pacific market.
           (9) Due to rounding, immaterial differences in numbers may exist.
           Impact of changes to commodity prices
           The prices we obtain for our products are a key driver of value for BHP. Fluctuations in these commodity prices affect our results,    Additional information
           including cash flows and asset values. The estimated impact of changes in commodity prices in FY2020 on our key financial measures
           is set out below.
                                                                                       Impact on profit    Impact on
                                                                                        after taxation    Underlying
                                                                                       from Continuing    EBITDA
                                                                                     operations (US$M)    (US$M)
            US$1/bbl on oil price                                                              24            37
            US¢1/lb on copper price                                                            24            35
            US$1/t on iron ore price                                                          163           233
            US$1/t on metallurgical coal price                                                 24            35     Shareholder information
            US$1/t on energy coal price                                                        10            14
            US¢1/lb on nickel price                                                             1             1


                                                                                                BHP Annual Report 2020  23