Page 324 - Annual Report 2020
P. 324

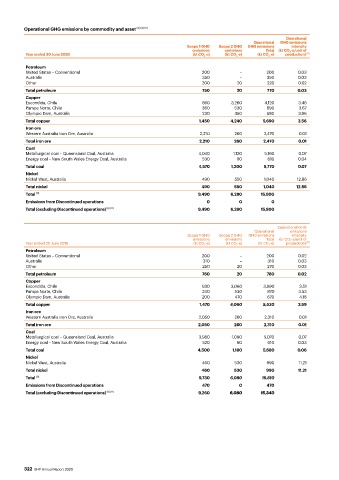
Operational GHG emissions by commodity and asset  (2) (4) (5)
                                                                                                     Operational
                                                                                          Operational   GHG emissions
                                                                   Scope 1 GHG   Scope 2 GHG   GHG emissions   intensity
                                                                     emissions  emissions     Total  (kt CO 2 -e/unit of
          Year ended 30 June 2020                                    (kt CO 2 -e)  (kt CO 2 -e)  (kt CO 2 -e)  production)  (12)
          Petroleum
          United States – Conventional                                  200          –         200        0.03
          Australia                                                     350          –         350        0.03
          Other                                                         200         20         220        0.02
          Total petroleum                                               750         20         770        0.03
          Copper
          Escondida, Chile                                              860       3,260       4,120       3.48
          Pampa Norte, Chile                                            360        530         890        3.67
          Olympic Dam, Australia                                        230        450         680        3.96
          Total copper                                                 1,450      4,240      5,690        3.56
          Iron ore
          Western Australia Iron Ore, Australia                        2,210       260        2,470       0.01
          Total iron ore                                               2,210       260       2,470        0.01
          Coal
          Metallurgical coal – Queensland Coal, Australia              4,040       1,120      5,160       0.07
          Energy coal – New South Wales Energy Coal, Australia          530         80         610        0.04
          Total coal                                                   4,570      1,200       5,770       0.07
          Nickel
          Nickel West, Australia                                        490        550        1,040      12.86
          Total nickel                                                  490        550        1,040      12.86
          Total  (11)                                                  9,490      6,280      15,800
          Emissions from Discontinued operations                          0          0          0
          Total (excluding Discontinued operations)  (8) (11)          9,490      6,280      15,800


                                                                                                   Operational GHG
                                                                                          Operational    emissions
                                                                   Scope 1 GHG   Scope 2 GHG   GHG emissions   intensity
                                                                     emissions  emissions      Total  (kt CO 2 -e/unit of
          Year ended 30 June 2019                                    (kt CO 2 -e)  (kt CO 2 -e)  (kt CO 2 -e)  production)  (12)
          Petroleum
          United States – Conventional                                  200          –         200        0.02
          Australia                                                     310          –         310        0.03
          Other                                                         250         20         270        0.03
          Total petroleum                                               760         20         780        0.02
          Copper
          Escondida, Chile                                              930       3,060       3,990       3.51
          Pampa Norte, Chile                                            340        530         870        3.53
          Olympic Dam, Australia                                        200        470         670        4.18
          Total copper                                                 1,470      4,060      5,530        3.59
          Iron ore
          Western Australia Iron Ore, Australia                        2,050       260        2,310       0.01
          Total iron ore                                               2,050       260        2,310       0.01
          Coal
          Metallurgical coal – Queensland Coal, Australia              3,980      1,090       5,070       0.07
          Energy coal – New South Wales Energy Coal, Australia          520         90         610        0.03
          Total coal                                                  4,500        1,180     5,680       0.06
          Nickel
          Nickel West, Australia                                        460        530         990        11.21
          Total nickel                                                  460        530         990        11.21
          Total  (11)                                                  9,730      6,080      15,810
          Emissions from Discontinued operations                        470          0         470
          Total (excluding Discontinued operations)  (8) (11)          9,260      6,080      15,340


          322  BHP Annual Report 2020
   319   320   321   322   323   324   325   326   327   328   329