
Page 317 - Annual Report 2020
P. 317
Species distributions for IUCN, the International Union for Conservation of Nature, listed species were downloaded from the Integrated
Biodiversity Assessment Tool, provided by Proteus Partners, in June 2020. Analysis was undertaken utilising ArcGIS by identifying all
species that occur within the area of influence of BHP’s operated assets, or areas where disturbance activities have been undertaken
in the previous 12 months. Lists of national species were identified from relevant national databases where available. Where national Strategic Report
databases were not available, species lists were compiled from in-house impact assessment reports and/or management plans.
A screening assessment was undertaken to remove any species that occur in biomes or habitats not impacted by the operated asset,
or where the operation occurs outside of the known distribution for the species, or where surveys/monitoring has determined that
the species or its habitat does not occur. Where national classifications differ to that utilised by the IUCN, species have been attributed
to the category that most closely aligns to their national ranking. In Canada, species may occur under more than one category. In these
instances, the higher ranking has been reported. This information is correct as of 30 June 2020 and is subject to change as more
information is obtained about species ranges, habitats and impacts from operated assets.
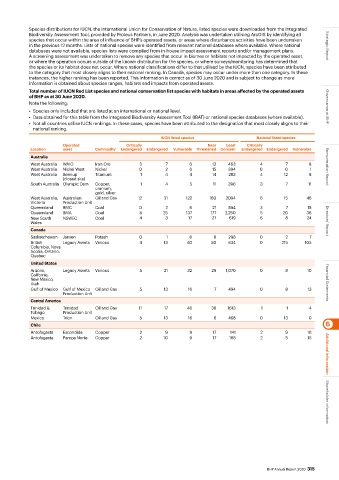
Total number of IUCN Red List species and national conservation list species with habitats in areas affected by the operated assets
of BHP as at 30 June 2020.
Note the following:
• Species only included that are listed at an international or national level. Governance at BHP
• Data obtained for this table from the Integrated Biodiversity Assessment Tool (IBAT) or national species databases (where available).
• Not all countries utilise IUCN rankings. In these cases, species have been attributed to the designation that most closely aligns to their
national ranking.
IUCN listed species National listed species
Operated Critically Near Least Critically
Location asset Commodity Endangered Endangered Vulnerable Threatened Concern Endangered Endangered Vulnerable
Australia
West Australia WAIO Iron Ore 3 7 6 12 463 4 7 8
West Australia Nickel West Nickel 0 2 6 15 394 0 0 1 Remuneration Report
West Australia Beenup Titanium 1 4 4 14 283 4 12 8
(closed site)
South Australia Olympic Dam Copper, 1 4 5 11 396 3 7 11
uranium,
gold, silver
West Australia, Australian Oil and Gas 12 31 122 160 2094 8 15 46
Victoria Production Unit
Queensland BMC Coal 0 2 6 21 594 3 7 15
Queensland BMA Coal 8 25 137 177 2,250 5 20 36
New South NSWEC Coal 4 3 17 27 619 6 8 24
Wales Directors’ Report
Canada
Saskatchewan Jansen Potash 0 1 6 8 298 0 2 7
British Legacy Assets Various 4 13 40 50 834 0 215 105
Columbia, Nova
Scotia, Ontario,
Quebec
United States
Arizona, Legacy Assets Various 5 21 32 29 1,070 0 8 10
California,
New Mexico,
Utah Financial Statements
Gulf of Mexico Gulf of Mexico Oil and Gas 5 13 16 7 494 0 8 13
Production Unit
Central America
Trinidad & Trinidad Oil and Gas 11 17 46 36 1613 1 1 4
Tobago Production Unit
Mexico Trion Oil and Gas 5 13 16 6 468 0 13 0
Chile 6
Antofagasta Escondida Copper 2 9 9 17 141 2 9 18
Antofagasta Pampa Norte Copper 2 10 9 17 168 2 5 15 Additional information
Shareholder information
BHP Annual Report 2020 315