
Page 316 - Annual Report 2020
P. 316
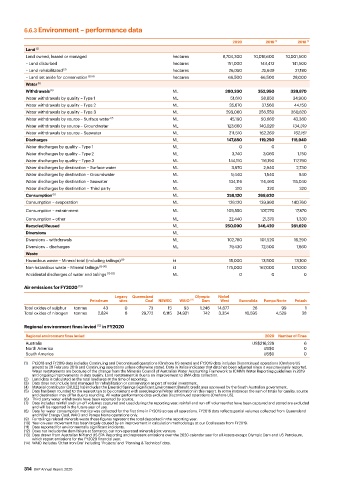
6.6.3 Environment – performance data


                                                                                   2020       2019  (1)   2018  (1)
          Land  (2)
          Land owned, leased or managed                       hectares         8,704,300  10,018,600  10,001,500
          – Land disturbed                                    hectares           151,000     144,413    141,500
          – Land rehabilitated  (3)                           hectares           26,050      25,649      27,180
          –  Land set aside for conservation  (3) (4)         hectares           66,500      66,500     28,000
          Water  (5)
          Withdrawals  (6)                                    ML                380,330     352,950    339,870
          Water withdrawals by quality – Type 1               ML                  51,610     58,850     34,900
          Water withdrawals by quality – Type 2               ML                  35,670     37,560     44,150
          Water withdrawals by quality – Type 3               ML                293,060     256,550    260,820
          Water withdrawals by source – Surface water  (7)    ML                  45,190     50,660     43,380
          Water withdrawals by source – Groundwater           ML                 123,660    140,020     134,319
          Water withdrawals by source – Seawater              ML                 211,510    162,260     162,161
          Discharges                                          ML                 147,850    119,250    118,940
          Water discharges by quality – Type 1                ML                     0          0           0
          Water discharges by quality – Type 2                ML                  3,740      3,060        1,150
          Water discharges by quality – Type 3                ML                 144,110     116,190    117,790
          Water discharges by destination – Surface water     ML                  3,970       2,940      2,730
          Water discharges by destination – Groundwater       ML                  9,440       1,540       840
          Water discharges by destination – Seawater          ML                 134,116    114,460     115,040
          Water discharges by destination – Third party       ML                    310        320        320
          Consumption  (8)                                    ML                 258,120    268,620
          Consumption – evaporation                           ML                 126,120    139,980     140,760
          Consumption – entrainment                           ML                 109,550    107,270      17,870
          Consumption – other                                 ML                 22,440      21,370      1,330
          Recycled/Reused                                     ML                250,090     246,420    261,620
          Diversions                                          ML
          Diversions – withdrawals                            ML                 102,780    101,520     16,290
          Diversions – discharges                             ML                 79,430      72,500      7,860
          Waste
          Hazardous waste – Mineral total (including tailings)  (9)  kt          15,000      13,500      13,100
          Non-hazardous waste – Mineral tailings  (9) (10)    kt                 175,000    167,000     137,000
          Accidental discharges of water and tailings  (11) (12)  ML                 0          0           0
          Air emissions for FY2020  (13)
                                         Legacy   Queensland          Olympic   Nickel
                                 Petroleum  sites   Coal  NSWEC  WAIO  (14)  Dam  West  Escondida    Pampa Norte  Potash
          Total oxides of sulphur  tonnes  43  0     73     15    93   1,246  14,677      26        99      1
          Total oxides of nitrogen  tonnes  2,824  8  29,772  6,115  24,921  742  3,354  10,595   4,529    38

          Regional environment fines levied  (12)  in FY2020
          Regional environment fines levied                                                   2020  Number of Fines
          Australia                                                                       US$216,229        6
          North America                                                                       US$0          0
          South America                                                                       US$0          0
          (1)   FY2018 and FY2019 data includes Continuing and Discontinued operations (Onshore US assets) and FY2019 data includes Discontinued operations (Onshore US
            assets) to 28 February 2019 and Continuing operations unless otherwise stated. Data in italics indicates that data has been adjusted since it was previously reported.
            Water restatements are because of the change from the Minerals Council of Australia’s Water Accounting Framework to ICMM’s Water Reporting guidelines in 2019
            and ongoing improvements in data quality. Land restatement is due to an improvement to BMA data collection.
          (2)   Land data is calculated as the total land area at the time of reporting.
          (3)   Data does not include land managed for rehabilitation or conservation as part of social investment.
          (4)  Material contributor (38,022 ha) includes the Emerald Springs Significant Environment Benefit credit area approved by the South Australian government.
          (5)   Data has been rounded to the nearest ten to be consistent with asset/regional Water information in this report. In some instances the sum of totals for quality, source
            and destination may differ due to rounding. All water performance data excludes Discontinued operations (Onshore US).
          (6)   Third party water withdrawals have been reported by source.
          (7)   Data includes rainfall and run-off volumes captured and used during the reporting year; rainfall and run-off volumes that have been captured and stored are excluded
            and will be reported in the future year of use.
          (8)   Data for water consumption metrics was collected for the first time in FY2019 across all operations. FY2018 data reflects partial volumes collected from Queensland
            and NSW Energy Coal, WAIO and Pampa Norte operations only.
          (9)   For tailings related minerals waste these figures represent the total deposited in the reporting year.
          (10)  Year-on-year movement has been largely caused by an improvement in calculation methodology at our Coal assets from FY2019.
          (11)   Data reported for environmentally significant incidents.
          (12)  Does not include the dam failure at Samarco, our non-operated minerals joint venture.
          (13)  Data drawn from Australian NPI and US EPA Reporting and represent emissions over the 2020 calendar year for all Assets except Olympic Dam and US Petroleum,
            which report emissions for the FY2020 financial year.
          (14)  WAIO includes ‘Other Iron Ore’ including ‘Projects’ and ‘Planning & Technical’ data.

          314  BHP Annual Report 2020