Page 313 - Annual Report 2020
P. 313

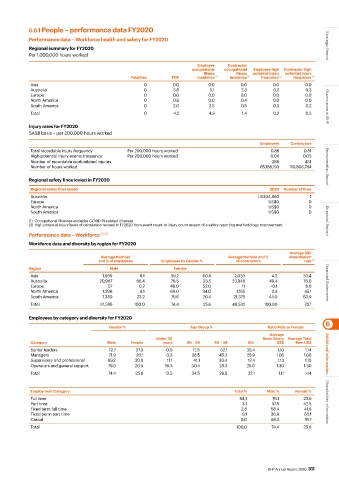
6.6.1 People – performance data FY2020

           Performance data – Workforce health and safety for FY2020
           Regional summary for FY2020                                                                              Strategic Report
           Per 1,000,000 hours worked

                                                                      Employee   Contractor
                                                                    occupational   occupational   Employee high   Contractor high
                                                                         illness    illness  potential injury  potential injury
                                               Fatalities    TRIF     incidence  (1)  incidence  (1)  frequency  (2)  frequency  (2)
            Asia                                    0         0.0         0.0         0.0        0.0        0.0
            Australia                               0         5.6          5.1        2.3        0.2        0.3
            Europe                                  0         0.0         0.0         0.0        0.0        0.0
            North America                           0         0.6         0.0         0.4        0.0        0.0
            South America                           0         2.0         2.5         0.5        0.3        0.2     Governance at BHP
            Total                                   0         4.2         4.3         1.4        0.2        0.3

           Injury rates for FY2020
           SASB basis – per 200,000 hours worked

                                                                                            Employees  Contractors
            Total recordable injury frequency  Per 200,000 hours worked                         0.88        0.81
            High potential injury events frequency  Per 200,000 hours worked                    0.04       0.05
            Number of recordable work-related injuries                                           286        451
            Number of hours worked                                                          65,188,193  110,806,784  Remuneration Report

           Regional safety fines levied in FY2020
            Regional safety fines levied                                                        2020  Number of fines
            Australia                                                                       US$34,860         1
            Europe                                                                             US$0          0
            North America                                                                      US$0          0
            South America                                                                      US$0          0
           (1)  Occupational illnesses excludes COVID-19 related illnesses.                                         Directors’ Report
           (2) High potential injury basis of calculation revised in FY2020 from event count to injury count as part of a safety reporting methodology improvement.
           Performance data – Workforce  (1) (2)
           Workforce data and diversity by region for FY2020
                                                                                                       Average (EE)
                                    Average Number                               Average Number and %    absenteeism
                                                                                                               (3)
                                    and % of employees    Employees by Gender %     of contractors          rate
           Region                       Male                  Female
            Asia                     1,939        6.1        39.2       60.8       2,033        4.2         33.4
            Australia               20,967       66.4        76.5       23.5       23,948       49.4        76.0
            Europe                     57         0.2        48.0       52.0          11        <0.1        8.0     Financial Statements
            North America            1,296        4.1        66.0       34.0        1,165       2.4         45.1
            South America            7,330       23.2        79.6       20.4       21,375      44.0        63.9
            Total                   31,589      100.0        74.4       25.6       48,532     100.00        70.1

           Employees by category and diversity for FY2020
                                                                                                                   6
                                       Gender %                     Age Group %                Ratio Male to Female
                                                                                                Average
                                                        Under 30                             Basic Salary  Average Total
            Category                   Male    Female     years    30 – 39  40 – 49     50+       US$    Rem US$
            Senior leaders             72.7      27.3      0.0       12.5     52.1      35.4      1.10      1.14
            Managers                   71.9      28.1      0.3      28.5      45.3      25.9      1.06      1.08    Additional information
            Supervisory and professional  69.2  30.8        11.1     41.1     30.4      17.4       1.13     1.18
            Operators and general support   79.5  20.5     16.3     30.4      28.3      25.0      1.30      1.30
            Total                      74.4      25.6      13.5     34.5      29.9      22.1       1.11     1.14


            Employment Category                                                    Total %     Male %    Female %
            Full time                                                                94.1        76.1       23.9
            Part time                                                                 3.1       57.5        42.5    Shareholder information
            Fixed term full time                                                      2.8       58.4        41.6
            Fixed perm part time                                                      0.1       36.9        63.1
            Casual                                                                    0.0       68.3        31.7
            Total                                                                   100.0       74.4        25.6


                                                                                               BHP Annual Report 2020  311
   308   309   310   311   312   313   314   315   316   317   318