
Page 314 - Annual Report 2020
P. 314
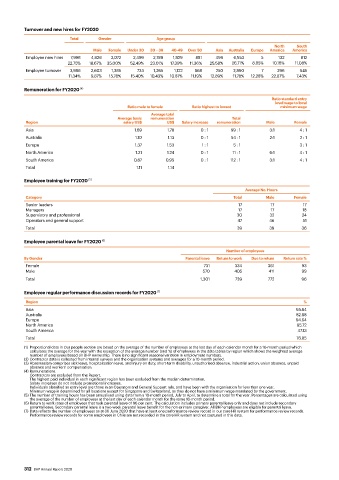
Turnover and new hires for FY2020
                          Total     Gender              Age group
                                                                                                 North   South
                                  Male  Female  Under 30  30 – 39  40-49  Over 50  Asia  Australia  Europe  America  America
          Employee new hires  7,998  4,926  3,072  2,499  2,789  1,829  881  496   6,553     5     132     812
                         22.75%  18.67%  35.00%  52.49%  23.01%  17.39%  11.36%  25.58%  26.71%  8.85%  10.18%  11.08%
          Employee turnover  3,988  2,603  1,385  733  1,265  1,122  868     250   2,890     7    296     545
                         11.34%  9.87%  15.78%  15.40%  10.43%  10.67%  11.19%  12.89%  11.78%  12.28%  22.87%  7.43%

          Remuneration for FY2020  (4)
                                                                                                Ratio standard entry
                                                                                                  level wage to local
                                              Ratio male to female  Ratio highest to lowest        minimum wage
                                                      Average total
                                          Average basic   remuneration             Total
          Region                            salary US$      US$  Salary increase  remuneration   Male   Female
          Asia                                  1.69        1.78        0 : 1     99 : 1        3:1       4 : 1
          Australia                              1.10       1.13        0 : 1     54 : 1        2:1       2 : 1
          Europe                                1.37        1.53        1 : 1      5 : 1                  3 : 1
          North America                          1.21       1.24        0 : 1      11 : 1       6:1       4 : 1
          South America                         0.87       0.95         0 : 1     112 : 1       3:1       4 : 1
          Total                                  1.11       1.14

          Employee training for FY2020  (5)
                                                                                       Average No. Hours
          Category                                                                 Total      Male      Female
          Senior leaders                                                             17         17         17
          Managers                                                                   17         17         18
          Supervisory and professional                                              30          32         24
          Operators and general support                                             47          46         51
          Total                                                                     39          39         36

          Employee parental leave for FY2020  (6)
                                                                                Number of employees
          By Gender                                               Parental leave  Return to work  Due to return  Return rate %
          Female                                                         731       334         361         93
          Male                                                          570        405         411         99
          Total                                                        1,301        739        772         96

          Employee regular performance discussion records for FY2020  (7)

          Region                                                                                            %
          Asia                                                                                           95.64
          Australia                                                                                      82.88
          Europe                                                                                         94.64
          North America                                                                                  95.72
          South America                                                                                   47.13
          Total                                                                                          76.85

          (1)  Proportional data in Our people section are based on the average of the number of employees at the last day of each calendar month for a 10-month period which
           calculates the average for the year with the exception of the average number (and %) of employees in the data tables by region which shows the weighted average
           number of employees based on BHP ownership. There is no significant seasonal variation in employment numbers.
          (2) Contractor data is collected from internal surveys and the organisation systems and averages for a 10-month period.
          (3) Absenteeism comprises sick leave, hospitalisation leave, and injury on duty, short-term disability, unauthorised absence, industrial action, union absence, unpaid
           absence and workers’ compensation.
          (4) Remunerations.
             Contractors are excluded from the Report.
             The highest paid individual in each significant region has been excluded from the median determination.
             Salary increases do not include promotional increases.
             Individuals classified as entry level are those in an Operators and General Support role, and have been with the organisation for less than one year.
             Minimum wage is determined for all locations except for Singapore and Switzerland, as they do not have a minimum wage mandated by the government.
          (5) The number of training hours has been annualised using data from a 10-month period, July to April, to determine a total for the year. Percentages are calculated using
           the average of the number of employees at the last day of each calendar month for the same 10-month period.
          (6) Return to work rates of employees that took parental leave of 96 per cent. The calculation includes primary parental leave only and does not include secondary
           parental leave. Secondary parental leave is a two-week parental leave benefit for the non-primary caregiver. All BHP employees are eligible for parental leave.
          (7) Data reflects the number of employees as at 30 June 2020 that have at least one performance review record in our core HR system for performance review records.
           Performance review records for some employees in Chile are not recorded in the core HR system and not captured in this data.


          312  BHP Annual Report 2020