
Page 68 - Annual Report 2020
P. 68
1.7.8 Climate change continued
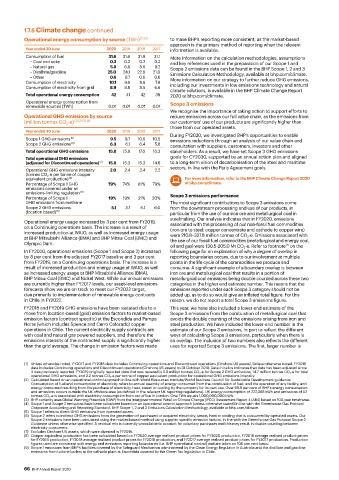
Operational energy consumption by source (TWh) (1) (2) to make BHP’s reporting more consistent, as the market-based
approach is the primary method of reporting when the relevant
Year ended 30 June 2020 2019 2018 2017 information is available.
Consumption of fuel 31.6 31.6 31.9 31.1 More information on the calculation methodologies, assumptions
– Coal and coke 0.2 0.2 0.2 0.2 and key references used in the preparation of our Scope 1 and
– Natural gas 5.8 6.6 8.6 9.2 Scope 2 emissions data can be found in the BHP Scope 1, 2 and 3
– Distillate/gasoline 25.0 24.1 22.6 21.0 Emissions Calculation Methodology, available at bhp.com/climate.
– Other 0.6 0.7 0.6 0.6 More information on our strategy to further reduce GHG emissions,
Consumption of electricity 10.1 9.6 9.6 7.8 including our investments in low emissions technology and natural
Consumption of electricity from grid 8.9 8.5 8.5 6.6 climate solutions, is available in the BHP Climate Change Report
Total operational energy consumption 42 41 42 39 2020 at bhp.com/climate.
Operational energy consumption from Scope 3 emissions
renewable sources (TWh) 0.01 0.01 0.01 0.01
We recognise the importance of taking action to support efforts to
Operational GHG emissions by source reduce emissions across our full value chain, as the emissions from
(million tonnes CO 2 -e) (1) (2) (3) (4) our customers’ use of our products are significantly higher than
those from our operated assets.
Year ended 30 June 2020 2019 2018 2017
During FY2020, we investigated BHP’s opportunities to enable
Scope 1 GHG emissions (5) 9.5 9.7 10.6 10.5 emissions reductions through an analysis of our value chain and
Scope 2 GHG emissions (6) 6.3 6.1 6.4 5.8 consultation with suppliers, customers, investors and other
Total operational GHG emissions 15.8 15.8 17.0 16.3 stakeholders. As a result, we have set Scope 3 GHG emissions
Total operational GHG emissions goals for CY2030, supported by an annual action plan and aligned
(adjusted for Discontinued operations) (7) 15.8 15.3 15.3 14.6 to a long-term vision of decarbonisation of the steel and maritime
Operational GHG emissions intensity 2.0 2.4 2.4 2.2 sectors, in line with the Paris Agreement goals.
(tonnes CO 2 -e per tonne of copper
equivalent production) (8) For more information, refer to the BHP Climate Change Report 2020
Percentage of Scope 1 GHG 79% 74% 81% 79% at bhp.com/climate.
emissions covered under an
emissions-limiting regulation (9) Scope 3 emissions performance
Percentage of Scope 1 19% 19% 21% 20%
GHG emissions from methane The most significant contributions to Scope 3 emissions come
Scope 2 GHG emissions 5.1 5.1 6.1 6.0 from the downstream processing and use of our products, in
(location based) (6) particular from the use of our iron ore and metallurgical coal in
steelmaking. Our analysis indicates that in FY2020, emissions
Operational energy usage increased by 3 per cent from FY2019, associated with the processing of our non-fossil fuel commodities
on a Continuing operations basis. The increase is a result of (iron ore to steel; copper concentrate and cathode to copper wire)
increased production at WAIO, as well as increased energy usage were 210.8–327.8 million tonnes of CO 2 -e. Emissions associated with
at BHP Mitsubishi Alliance (BMA) and BHP Mitsui Coal (BMC) and the use of our fossil fuel commodities (metallurgical and energy coal,
Olympic Dam. oil and gas) were 130.5-205.0 Mt CO 2 -e. Refer to footnote on the
(1)
In FY2020, operational emissions (Scope 1 and Scope 2) increased following page for an explanation of why a degree of overlap in
by 8 per cent from the adjusted FY2017 baseline and 3 per cent reporting boundaries occurs, due to our involvement at multiple
from FY2019, on a Continuing operations basis. The increase is a points in the life cycle of the commodities we produce and
result of increased production and energy usage at WAIO, as well consume. A significant example of a boundary overlap is between
as increased energy usage at BHP Mitsubishi Alliance (BMA), iron ore and metallurgical coal that results in a portion of
BHP Mitsui Coal (BMC) and Nickel West. While our annual emissions metallurgical coal emissions being double counted across these two
are currently higher than FY2017 levels, our asset-level emissions categories in the higher end estimate number. This means that the
forecasts show we are on track to meet our FY2022 target, emissions reported under each Scope 3 category should not be
due primarily to implementation of renewable energy contracts added up, as to do so would give an inflated total figure. For this
in Chile in FY2022. reason, we do not report a total Scope 3 emissions figure.
FY2018 and FY2019 GHG emissions have been restated due to a This year, we have also included a lower end estimate of the
move from location-based (grid) emission factors to market-based Scope 3 emissions from the combustion of metallurgical coal that
emission factors (contract specific) at the Escondida and Pampa avoids the double counting of the emissions arising from iron and
Norte (which includes Spence and Cerro Colorado) copper steel production. We have included the lower-end number in the
operations in Chile. The current electricity supply contracts are estimate of our Scope 3 emissions, in part to reflect the different
with coal and natural gas powered suppliers, and therefore the ways of calculating Scope 3 emissions, particularly when there is
emissions intensity of the contracted supply is significantly higher an overlap. The inclusion of two numbers also reflects the different
than the grid average. The change in emission factors was made uses for reported Scope 3 emissions. The first, larger number is
(1) Unless otherwise noted, FY2017 and FY2018 data includes Continuing operations and Discontinued operations (Onshore US assets). Unless otherwise noted, FY2019
data includes Continuing operations and Discontinued operations (Onshore US assets) to 31 October 2018. Data in italics indicates that data has been adjusted since
it was previously reported. FY2019 originally reported data that was restated is 5.0 million tonnes CO 2 -e for Scope 2 GHG emissions, 14.7 million tonnes CO 2 -e for total
operational GHG emissions, and 2.2 tonnes CO 2 -e per tonne of copper equivalent production for operational GHG emissions intensity.
(2) Calculated based on an operational control approach in line with World Resources Institute/World Business Council for Sustainable Development guidance.
Consumption of fuel and consumption of electricity refers to annual quantity of energy consumed from the combustion of fuel; and the operation of any facility; and
energy consumed resulting from the purchase of electricity, heat, steam or cooling by the company for its own use. Over 99.9 per cent of BHP’s energy consumption
and emissions occurs outside the UK offshore area (as defined in the relevant UK reporting regulations). UK energy consumption of 222,368 kWh and emissions of 52
tonnes CO 2 -e is associated with electricity consumption from our office in London. One TWh equals 1,000,000,000 kWh.
(3) BHP currently uses Global Warming Potentials (GWP) from the Intergovernmental Panel on Climate Change (IPCC) Assessment Report 4 (AR4) based on 100-year timeframe.
(4) Scope 1 and Scope 2 emissions have been calculated based on an operational control approach (unless otherwise stated) in line with the Greenhouse Gas Protocol
Corporate Accounting and Reporting Standard. BHP Scope 1, 2 and 3 Emissions Calculation Methodology, available at bhp.com/climate.
(5) Scope 1 refers to direct GHG emissions from operated assets.
(6) Scope 2 refers to indirect GHG emissions from the generation of purchased or acquired electricity, steam, heat or cooling that is consumed by operated assets. Our
Scope 2 emissions have been calculated using the market-based method using supplier specific emission factors, in line with the Greenhouse Gas Protocol Scope 2
Guidance unless otherwise specified. A residual mix is currently unavailable to account for voluntary purchases and this may result in double counting between
electricity consumers.
(7) Excludes Onshore US assets, which were divested in FY2019.
(8) Copper equivalent production has been calculated based on FY2020 average realised product prices for FY2020 production, FY2019 average realised product prices
for FY2019 production, FY2018 average realised product prices for FY2018 production, and FY2017 average realised product prices for FY2017 production. Production
figures used are consistent with energy and emissions reporting boundaries (i.e. BHP operational control) and are taken on 100 per cent basis.
(9) Scope 1 emissions from BHP’s facilities covered by the Safeguard Mechanism administered by the Clean Energy Regulator in Australia and the distillate and gasoline
emissions from turbine boilers at the cathode plant at Escondida covered by the Green Tax legislation in Chile.
66 BHP Annual Report 2020