
Page 331 - Annual Report 2020
P. 331
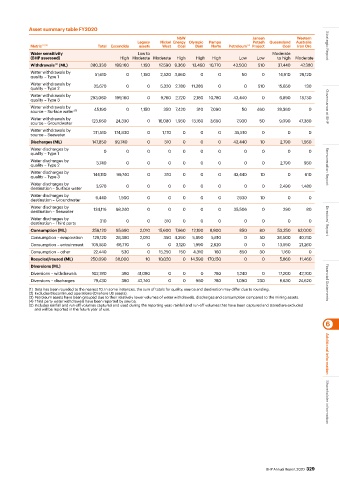
Asset summary table FY2020
                                                               NSW                        Jansen         Western
                                                 Legacy   Nickel  Energy  Olympic   Pampa   Potash   Queensland   Australia
            Metric  (1) (2)        Total  Escondida  assets   West  Coal  Dam  Norte  Petroleum  (3)  Project   Coal  Iron Ore  Strategic Report
            Water sensitivity                    Low to                                          Moderate
            (BHP assessed)                 High Moderate Moderate  High  High  High  Low   Low    to high  Moderate
                     (4)
            Withdrawals  (ML)    380,330  199,160  1,150  17,590 9,360  13,460  10,770  43,500  510  37,440  47,380
            Water withdrawals by    51,610   0     1,150  2,520 3,860  0      0       50     0     14,910  29,120
            quality – Type 1
            Water withdrawals by
            quality – Type 2      35,670     0       0   5,320  2,780  11,280  0       0    510    15,650   130
            Water withdrawals by    293,060  199,160  0  9,760  2,720  2,180  10,780  43,440  0    6,890  18,130
            quality – Type 3
            Water withdrawals by    45,190   0     1,150  350  7,420  310  7,090      50   460    28,360     0      Governance at BHP
            source – Surface water  (5)
            Water withdrawals by
            source – Groundwater  123,660  24,330    0   16,080  1,950  13,160  3,690  7,930  50   9,090  47,380
            Water withdrawals by    211,510  174,830  0   1,170  0     0      0    35,510    0        0      0
            source – Seawater
            Discharges (ML)      147,850  99,740     0     310   0     0      0    43,440   10     2,790   1,560
            Water discharges by      0       0       0      0    0     0      0        0     0        0      0
            quality – Type 1
            Water discharges by    3,740     0       0      0    0     0      0        0     0     2,790    950
            quality – Type 2                                                                                        Remuneration Report
            Water discharges by
            quality – Type 3      144,110  99,740    0     310   0     0      0    43,440   10        0     610
            Water discharges by    3,970     0       0      0    0     0      0        0     0     2,490   1,480
            destination – Surface water
            Water discharges by    9,440   1,500     0      0    0     0      0     7,930   10        0      0
            destination – Groundwater
            Water discharges by
            destination – Seawater  134,116  98,240  0      0    0     0      0    35,506    0      290      80
            Water discharges by     310      0       0     310   0     0      0        0     0        0      0
            destination – Third party                                                                               Directors’ Report
            Consumption (ML)     258,120  95,680  2,010  15,600  7,660  12,190  8,800  850  80    53,250  62,000
            Consumption – evaporation  126,120  28,380  2,010  350 4,390  5,890  5,810  0   50    38,500  40,740
            Consumption – entrainment  109,550  66,770  0   0  3,120  1,990  2,820     0     0     13,590  21,260
            Consumption – other   22,440    530      0   15,250  150  4,310  160     850    30      1,160    0
            Recycled/reused (ML)  250,090  38,000   10   10,020  0  14,590  170,150    0     0     5,860  11,460
            Diversions (ML)
            Diversions – withdrawals  102,780  380  41,080  0    0     0    780     1,240    0     17,200  42,100
            Diversions – discharges  79,430  380  42,740    0    0    960   780     1,090  230     8,630  24,620    Financial Statements
           (1)  Data has been rounded to the nearest 10. In some instances, the sum of totals for quality, source and destination may differ due to rounding.
           (2) Excludes Discontinued operations (Onshore US assets).
           (3) Petroleum assets have been grouped due to their relatively lower volumes of water withdrawals, discharges and consumption compared to the mining assets.
           (4) Third party water withdrawals have been reported by source.
           (5) Includes rainfall and run-off volumes captured and used during the reporting year; rainfall and run-off volumes that have been captured and stored are excluded
             and will be reported in the future year of use.
                                                                                                                   6


                                                                                                                    Additional information


                                                                                              BHP Annual Report 2020  329  Shareholder information