Page 6 - BHP Economic Contribution Report 2020
P. 6

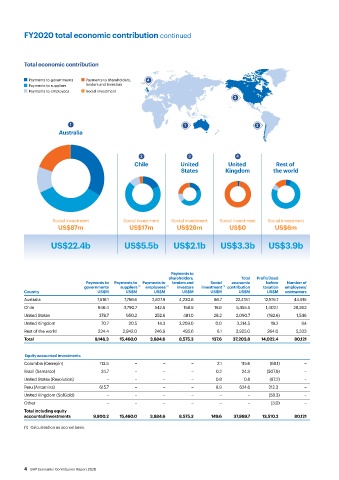
FY2020 total economic contribution continued


          Total economic contribution


           Payments to governments  Payments to shareholders,   4
           Payments to suppliers  lenders and investors
           Payments to employees  Social investment
                                                                                   3


                          1                                       1                        2
                      Australia


                                                  2                3                4
                                                Chile           United           United           Rest of
                                                                 States         Kingdom          the world


                   Social investment        Social investment  Social investment  Social investment  Social investment
                     US$87m                   US$17m           US$28m             US$0            US$6m

                   US$22.4b                  US$5.5b          US$2.1b         US$3.3b          US$3.9b


                                                             Payments to
                                                            shareholders,             Total   Profit/(loss)
                               Payments to   Payments to  Payments to  lenders and   Social  economic   before   Number of
                               governments  suppliers  (1)  employees  (1)  investors  investment  (1)  contribution  taxation  employees/
          Country                  US$M      US$M      US$M      US$M      US$M      US$M      US$M  contractors
          Australia                7,516.1   7,756.6  2,827.9   4,230.8     86.7    22,418.1  12,519.7  44,915
          Chile                    946.4    3,790.7    542.9     158.9      16.6    5,455.5   1,402.1   28,263
          United States             378.7    950.2     252.6     481.0      28.2    2,090.7    (182.6)   1,546
         United Kingdom              70.7     20.5      14.3    3,209.0      0.0    3,314.5     19.2       64
         Rest of the world         234.4    2,942.0    246.9     495.6       6.1    3,925.0    264.0     5,333
         Total                    9,146.3  15,460.0   3,884.6   8,575.3    137.6   37,203.8  14,022.4   80,121

          Equity accounted investments
          Colombia (Cerrejón)       113.5       –         –         –        2.1      115.6     (68.1)      –
          Brazil (Samarco)           24.7       –         –         –        0.2      24.9     (507.9)      –
          United States (Resolution)  –         –         –         –        0.8       0.8      (87.2)      –
         Peru (Antamina)            615.7       –         –         –        8.9     624.6     212.3        –
         United Kingdom (SolGold)     –         –         –         –         –         –      (58.3)       –
         Other                        –         –         –         –         –         –       (3.0)       –
         Total including equity
         accounted investments    9,900.2  15,460.0   3,884.6   8,575.3    149.6   37,969.7  13,510.2   80,121

          (1)  Calculated on an accrual basis.


          4  BHP Economic Contribution Report 2020
   1   2   3   4   5   6   7   8   9   10   11